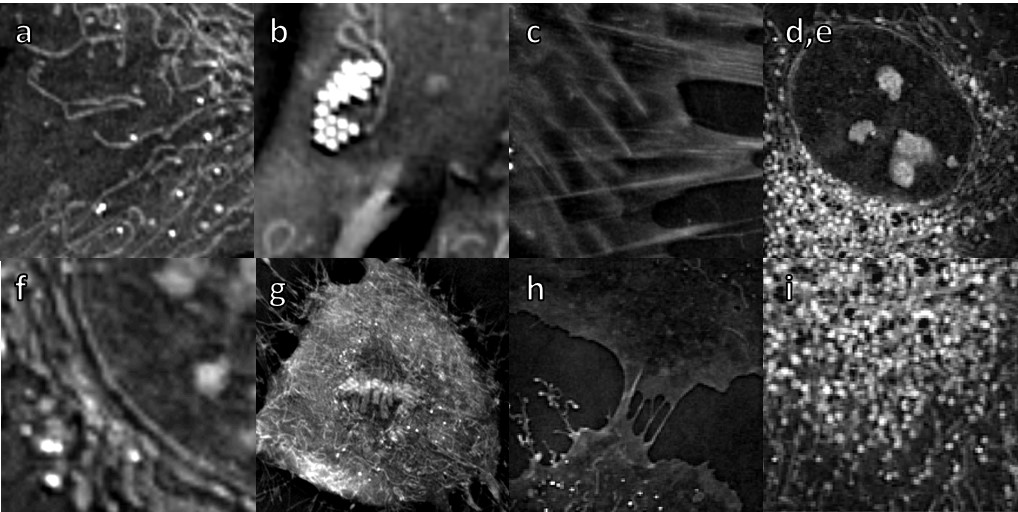
Cell organelles
Researchers from EPFL demonstrated and published on PLOS Biology that mammalian cellular organelles such as lipid droplets (LDs) and mitochondria show specific RI 3D patterns. Moreover, they could observe the shape and dry mass dynamics of LDs, endocytic structures, and entire cells’ division that have so far, to the best of our knowledge, been out of reach. Finally, they could capture the motion of many organelles at the same time to report a multiorganelle spinning phenomenon and study its dynamic properties.
Download here our poster “Quantifying dry mass dynamics in lipid droplets using Nanolive cell imaging”.
Nanolive imaging allows characterizing multiple cell organelles in high resolution and with high sensitivity based on their refractive index. You can explore and measure up to 9 cell organelles simultaneously with unprecedented detail and resolution, marker-free and preparation-free based on their own physical density.

a. Mitochondria
Mitochondrial morphology is important for the function of the cell and, accordingly, altered mitochondrial structure is observed in many pathologies.
However, until today, long-time imaging of mitochondria has been impossible since it relied on the use of fluorescent markers which are toxic to the mitochondria and to the cell in general.
Nanolive imaging allows for the very first time to image living mitochondria at high resolution and high frequency, without impacting the cell health.
Thanks to the high spatio-temporal resolution proper of Nanolive’s technology dynamic details of fusions, fissions and mitochondrial network remodeling can be easily characterized.
b. Lipid droplets
Lipid droplets (LDs) are the major cellular organelles for the storage of lipids. LDs are dynamic structures which play an important role in lipid and energy metabolism actively interacting with other organelles [e.g. mitochondria]. Nanolive imaging enables lipid characterization; 3D localization of LDs inside living cells; volume measurements and real-time lipogenesis monitoring. This video demonstrates LDs with fluo marker Bodipy and with digital stain.
c. Actin stress fibers
Stress fibers are bundles of highly compact filamentous actin resulting from actin polymerization that are associated with several cytoskeletal proteins like myosin II and α-actinin in non-muscle cells. They are connected to the underlying matrix – fibronectin in our case – at one or both ends in structures known as focal adhesions.
The high concentration of proteins in stress fibers leads to a detectable refractive index that allows us to visualize the structure under the Nanolive microscopes.
d./ e. / f. / g. Nucleus, Nucleoli, Nuclear membrane, Chromosomes
The 3D Cell Explorer is able to discriminate different phases of the cell cycle based on chromatin RI values and monitor changes in nuclear RI, shape and size during mitosis (e.g. DNA condensation, chromosomes alignment and segregation, mitotic spindle formation, metaphase plate, sister chromatids, contractile ring).
Furthermore, it is possible to follow changes in cellular shape and thickness during cell division and measure the processes of surface attachment/detachment.
This video shows Mesenchymal Stem Cells undergoing mitosis.
h. Plasma membrane
The plasma membrane is a relatively thin yet important interface zone at which many processes that are critical to the cell occur. The phospholipid bilayer acts as both a barrier and a point for interaction with the external environment from which it can internalize and to which it secretes molecules.
Nanolive imaging allows to image this important organelle marker-free and to visualize processes as endocytosis (pinocytosis and phagocytosis) or membrane ruffling in an unprecedented fashion.
Please visit our page about endocytosis here: https://www.nanolive.ch/endocytosis/ and our blogpost about endothelial cell protrusions here: https://www.nanolive.ch/protrusions-in-human-umbilical-vein-endothelial-cells/.
i. Endocytic structures
Endocytosis refers to the process of internalization of substances into the cell.
There are two main types of endocytosis: phagocytosis and pinocytosis. While during phagocytosis (video), large particles and bacteria are engulfed, in pinocytosis fluid and molecules contained in it are brought into the cell.
Endocytosis involves cytoskeletal and structural modifications. The 3D Cell Explorer allows visualizing of fine membrane deformations and posterior vesicle formation that occur in endocytic processes.
f. Cilia
Recent advances in ‘omic’ methodologies and in live cell imaging techniques has renewed interest in understanding MCCs2. Most studies use the African clawed frog (Xenopus laevis) as a model system in cilia research4,5. Here, MCCs were obtained by in vitro differentiation of Xenopus-derived cell culture and were imaged using Nanolive’s 3D Cell Explorer. Images were acquired for 10 mins at an acquisition frequency of 1 image every 20 secs.
PLOS Biology: Image-based analysis of living mammalian cells using label-free 3D refractive index maps reveals new organelle dynamics and dry mass flux
In this paper published in PLOS Biology in December 2019 by using Nanolive’s 3D Cell Explorer-fluo, researchers from EPFL could observe changes in cell size during division, organelle movements, and the formation of tiny lipid droplets – all over an extended period and without damaging the cell. They then quantified the observed phenomena using software specially designed to sift through the mass of raw imaging data.
Taken together, the data paints a detailed picture of a cell’s structure and chemical composition, allowing scientists to precisely calculate dry mass, morphology, cell membrane dynamics and other features.
The label-free, non-invasive imaging technique meant the team could observe the cells over an extended period of time. But one of the major advantages was the ability of Nanolive Imaging to capture several biological phenomena and objects at the same time, enabling researchers to observe organelle rotation and other complex cellular dynamics involving multiple subcellular structures.

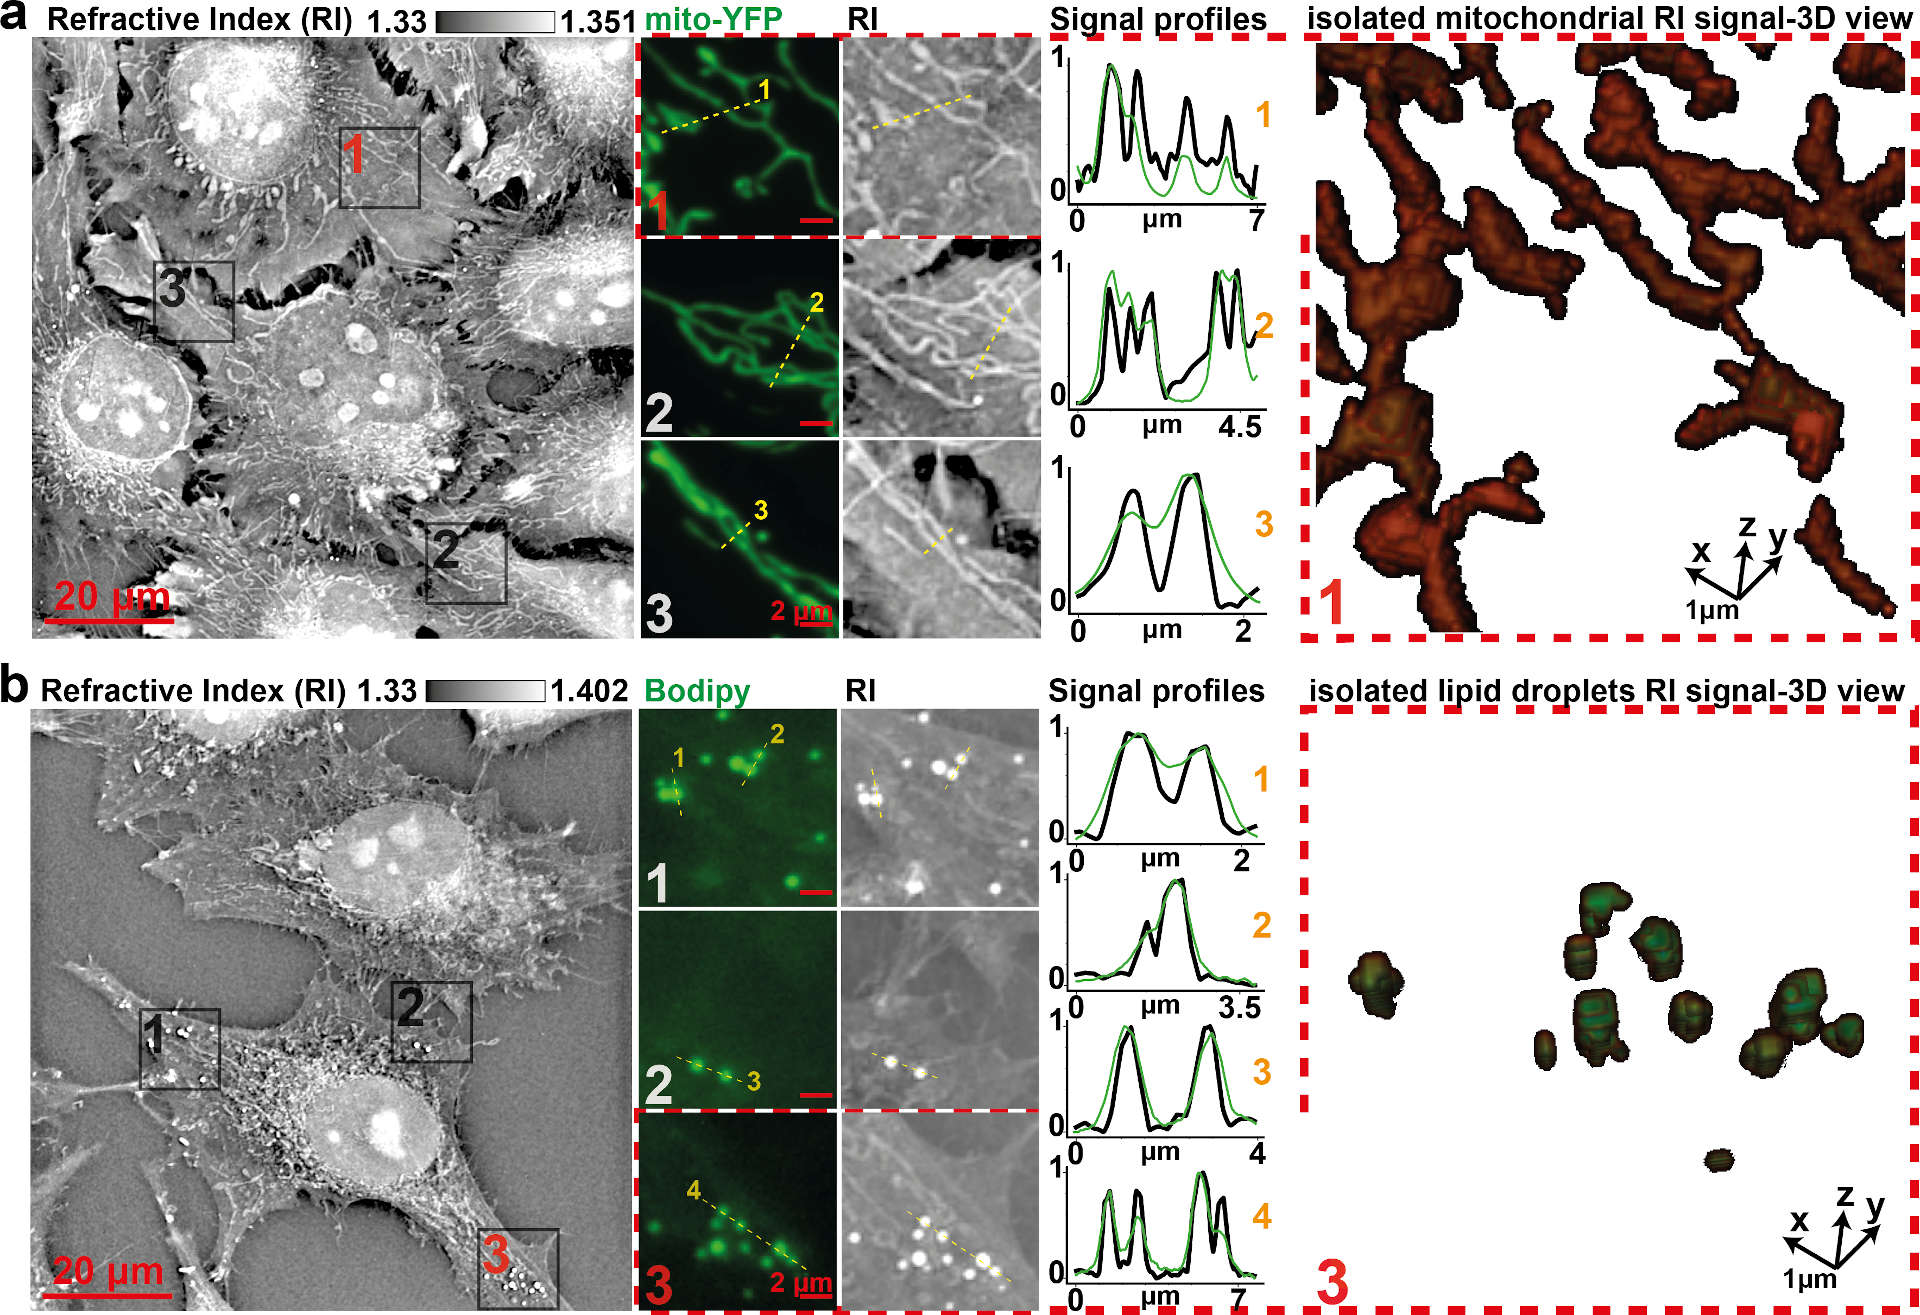
Fig 2. Comparison of specific fluorescent signals and RI map.
Visual and profile comparison, as well as 3D view, of (a) HeLa cells’ RI map to mitochondria-specific fluorescent signal (Mito-YFP) or (b) to an LD-specific fluorescent signal (Bodipy) shows specificity and gain in resolving power. Profiles were normalized between 0 and 1 for proper scaling. LD, lipid droplet; RI, refractive index; YFP, yellow fluorescent protein. Source: https://journals.plos.org/plosbiology/article?id=10.1371/journal.pbio.3000553
Video Library
Lipid droplets with Nanolive imaging
Marker-free 3D visualization of lipid droplets through digital stain
