The 3D Cell Explorer-fluo
Multimodal complete solution: combine high quality non-invasive 4D live cell imaging with epifluorescence for your lab, department, or institute Request a quote or a demo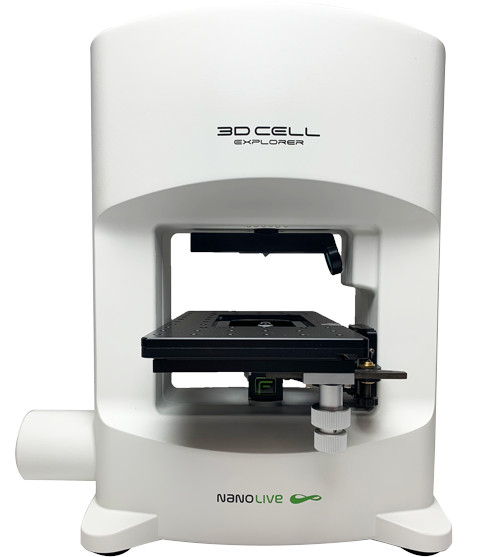
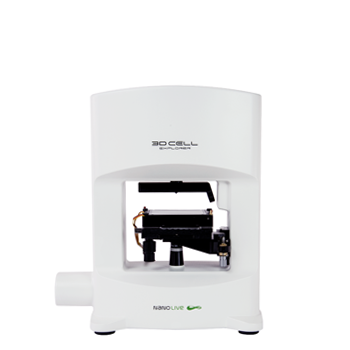
Image: 3D Cell Explorer-fluo
Video: Linking changes in cell morphology to adenovirus infection
Multimodal complete solution: 4D live cell imaging & fluorescence
3D Cell Explorer-fluo
- Combine fully label-free imaging with correlative epifluorescence to cover a broad array of live cell imaging requirements for your lab, department, or institute
- Rediscover your living cells through multiplexing: Nanolive datasets contain the simultaneous acquisition of several biological features and organelles – therefore capturing various pathways of cell biology in real-time
- Extend Live Cell Imaging: image your live cells as long as you need. Limit cell damages caused by fluorescent markers, bleaching and phototoxicity
- Visualize the invisible: the 3D Cell Explorer-fluo allows you to visualize what would be too small to be captured label-free, such as: proteins, ions (e.g. calcium), viruses, etc
Applications
A selected overview of Nanolive’s top applications.
Human bone osteosarcoma epithelial cells (U2OS) cells expressing Histone 2B-GFP and LAMP1-RFP
Fully integrated cutting-edge digital analytical solutions
Get higher significance earlier and faster with our panel of application specific, push-button digital assays. Retroactive analysis is also possible at any time.
Profile cell health and death, and distinguish between living, apoptotic, and necrotic cells label-free.
Measure and characterize simultaneously how live T cells find, bind, stress, and serial kill their targets.
Measure lipid droplet characteristics at population, cellular, and individual droplet levels.
Disruptive Technology
Visit our technology page here >
The combination of holography and rotational scanning makes Nanolive imaging a revolutionary technology
Nanolive’s technology is unique because it works label-free and reports the 3D refractive index distribution of the cell. The extremely low light power that generates the holograms allows for a total absence of phototoxicity which leads to excellent time resolution.
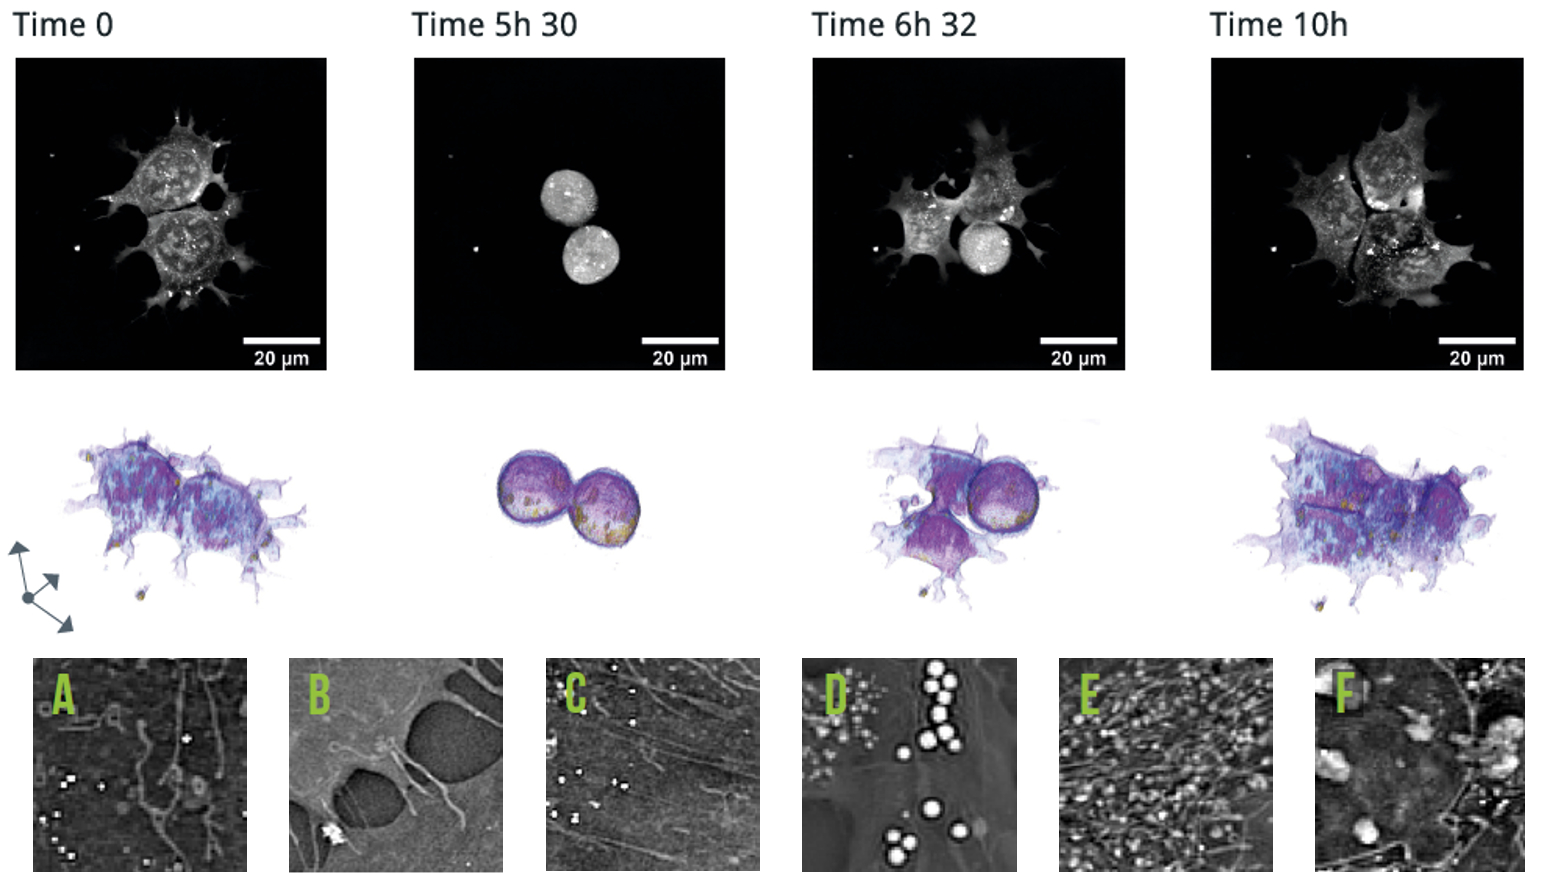
Top Image: 10h time-lapse of mESC undergoing mitosis (Refractive Index and 3D visualization). Bottom image: Organelles which are visible label-free with Nanolive technology: a. mitochondria; b. plasma membrane; c. actin fibers; d. lipid droplets; e. lysosomes; f. nuclear envelope, nucleus & nucleoli.

Disruptive Technology
Visit our technology page here >
The combination of holography and rotational scanning makes Nanolive imaging a revolutionary technology
Nanolive’s technology is unique because it works label-free and reports the 3D refractive index distribution of the cell. The extremely low light power that generates the holograms allows for a total absence of phototoxicity which leads to excellent time resolution.

Top Image: 10h time-lapse of mESC undergoing mitosis (Refractive Index and 3D visualization). Bottom image: Organelles that are visible label-free with Nanolive technology: a. mitochondria; b. plasma membrane; c. actin fibers; d. lipid droplets; e. lysosomes; f. nuclear envelope, nucleus & nucleoli.

Technical Specifications
Nanolive imaging and analysis platforms
Swiss high-precision imaging and analysis platforms that look instantly inside label-free living cells in 3D
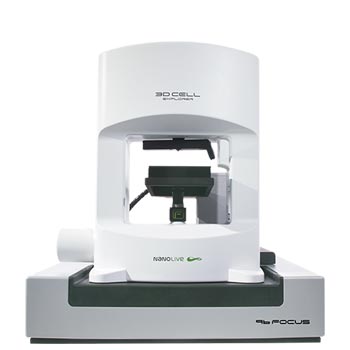
3D CELL EXPLORER 96focus
Automated label-free live cell imaging and analysis solution: a unique walk-away solution for long-term live cell imaging of single cells and cell populations
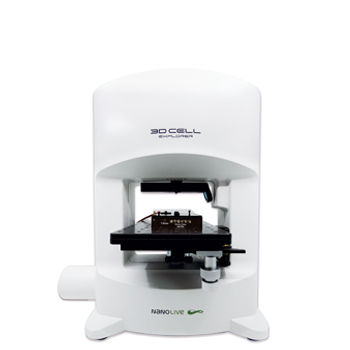
3D CELL EXPLORER-fluo
Multimodal Complete Solution: combine high quality non-invasive 4D live cell imaging with fluorescence
3D CELL EXPLORER
Budget-friendly, easy-to-use, compact solution for high quality non-invasive 4D live cell imaging
