EVE Analytics
Nanolive’s essential image analysis package EVE Analytics: acquire, view, analyze your live cell results Request a quote or demoEVE Analytics – Continuous, multiplexed live cell data, multi-parametric readout
Nanolive’s 3D Cell Explorer 96focus and 3D Cell Explorer-fluo together with its quantification software EVE Analytics, represents a significant breakthrough in the field of quantitative live cell imaging and analysis.
EVE Analytics’ user-friendly interface offers a segmentation and analysis solution specific to Nanolive’s content rich data which can deliver meaningful metrics with the highest biological relevance.
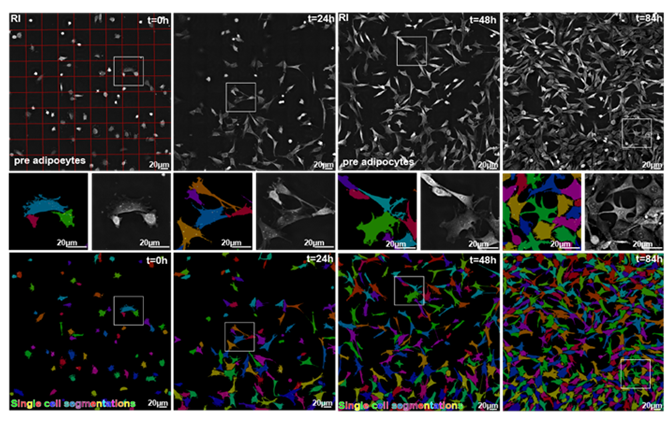
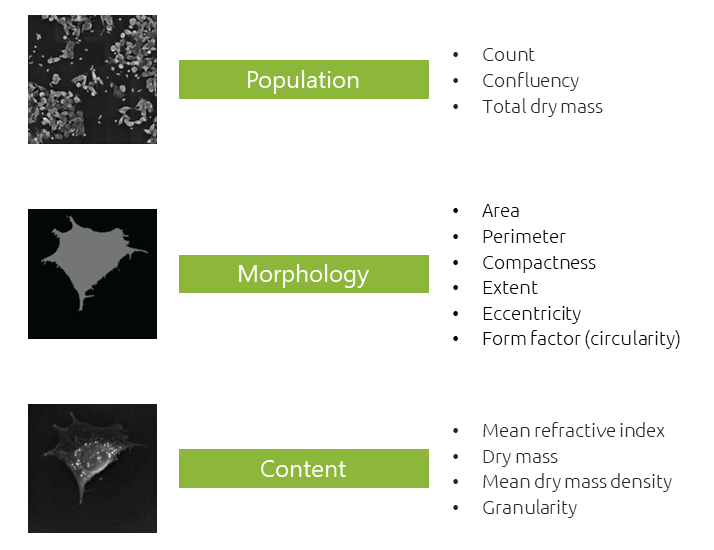
Works over long-term experiments where cell confluency changes significantly with no reduction in quality and automatically calculates and delivers numerous live cell metrics in parallel such as dry mass, cell count, cell confluency, cell circularity, cell perimeter, cell area, etc.
Applications
Bringing target context into phenotypic drug discovery
Cell behavior is a more accurate representation of disease than a single molecular target, so the activity of therapeutic candidates will likely be more predictable in the clinic.
Quantifying changes in cell behavior unveils new targets in diseases for which there are currently no known targets.
Video: Pre-adipocytes become rounder and lose dry mass | Glioblastoma cells division is heavily impacted from start
Video: RTK-inhibition provokes cell death in both cell population but triggers different types of cell death: apoptosis in pre-adipocytes and necroptosis in glioblastoma cells.
Automatically extract continuous, multiplexed, multi-parametric data
Nanolive’s continuous, multiplexed, multi-parametric data accurately delivers simultaneous analysis of cell morphology, composition, and population dynamics of living cells over long periods of time from seconds to weeks.
Nanolive's automated imaging platform
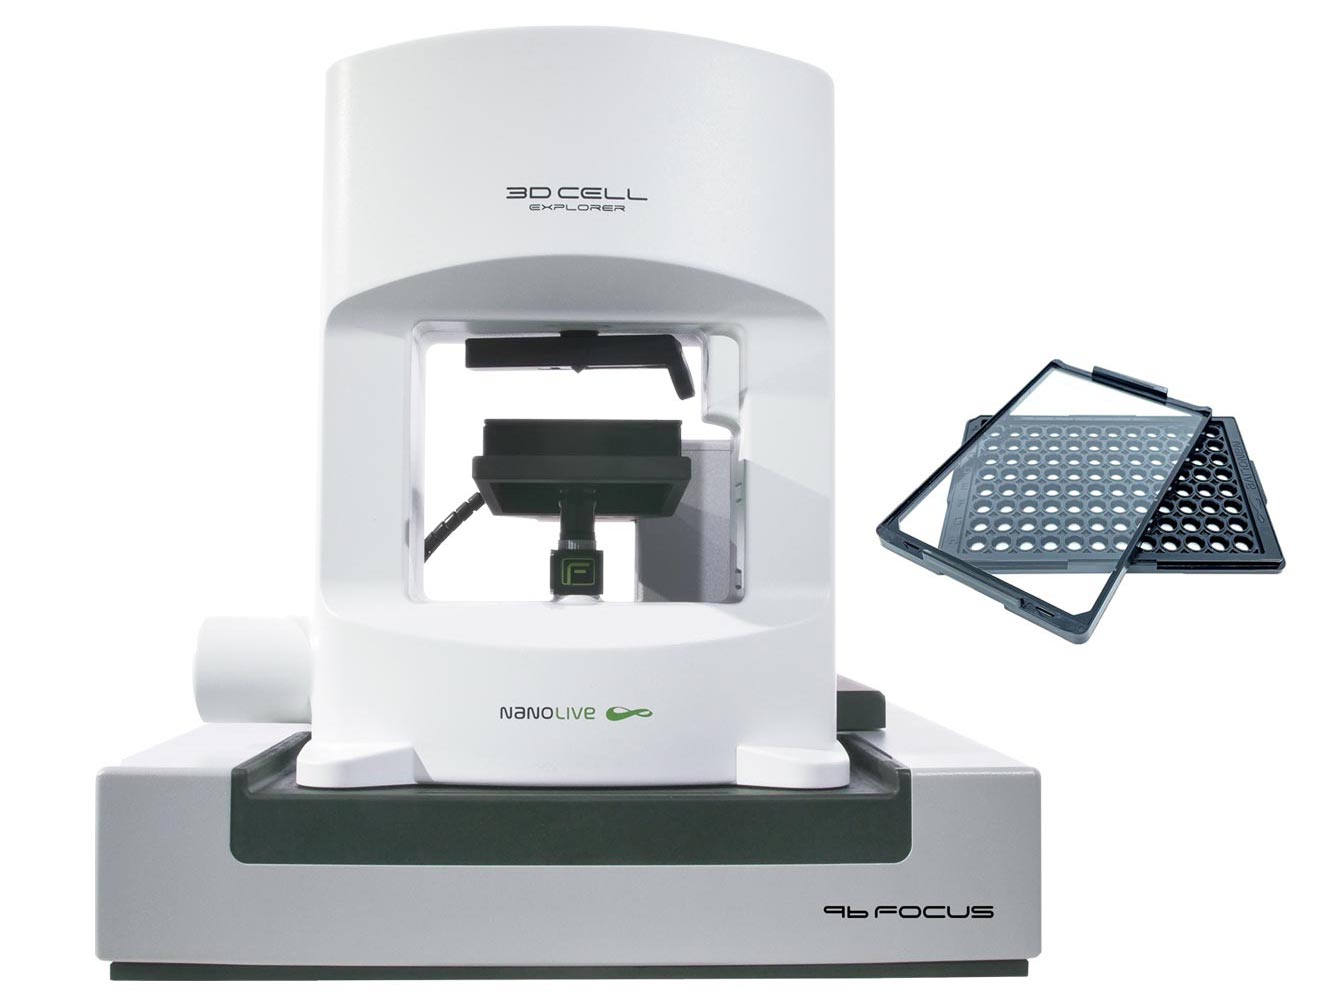
The 3D Cell Explorer 96focus
Unlock the power of unlimited high content live cell analysis with the 3D Cell Explorer 96focus. Our unique approach enables analysis and re-analysis of label-free image data with our AI-powered digital assays. As always, the simple, autonomous workflow ensures that your precious time in the lab is used efficiently, and you can be confident that your samples are in good hands, whether you are imaging for an hour, or days.
- Streamlined, automated workflows: save time and money
- Long-term monitoring of cells label-free
- High content, multiplexed, reliable live cell data
- Fully integrated, cutting-edge digital analysis solutions
Technical Note
Nanolive’s label-free technology makes it possible to image cells for long periods of time, at high temporal resolution. The quantity and complexity of the images generated allows us to visualize biological processes in unprecedented detail, but also magnifies the challenges associated with image analysis. Manual image registration and analysis is impossible and so computer-aided processing must be used to harness data complexity. In this technical note, we introduce the key elements involved in cell segmentation, which are essential to understand the novelty of EVE Analytics (EA), Nanolive’s software solution for quantitative cell analysis. We then evaluate the performance of EA segmentation against fluorescence-based segmentation and compare how metrics produced by both approaches differ.
EVE Analytics Product Presentation
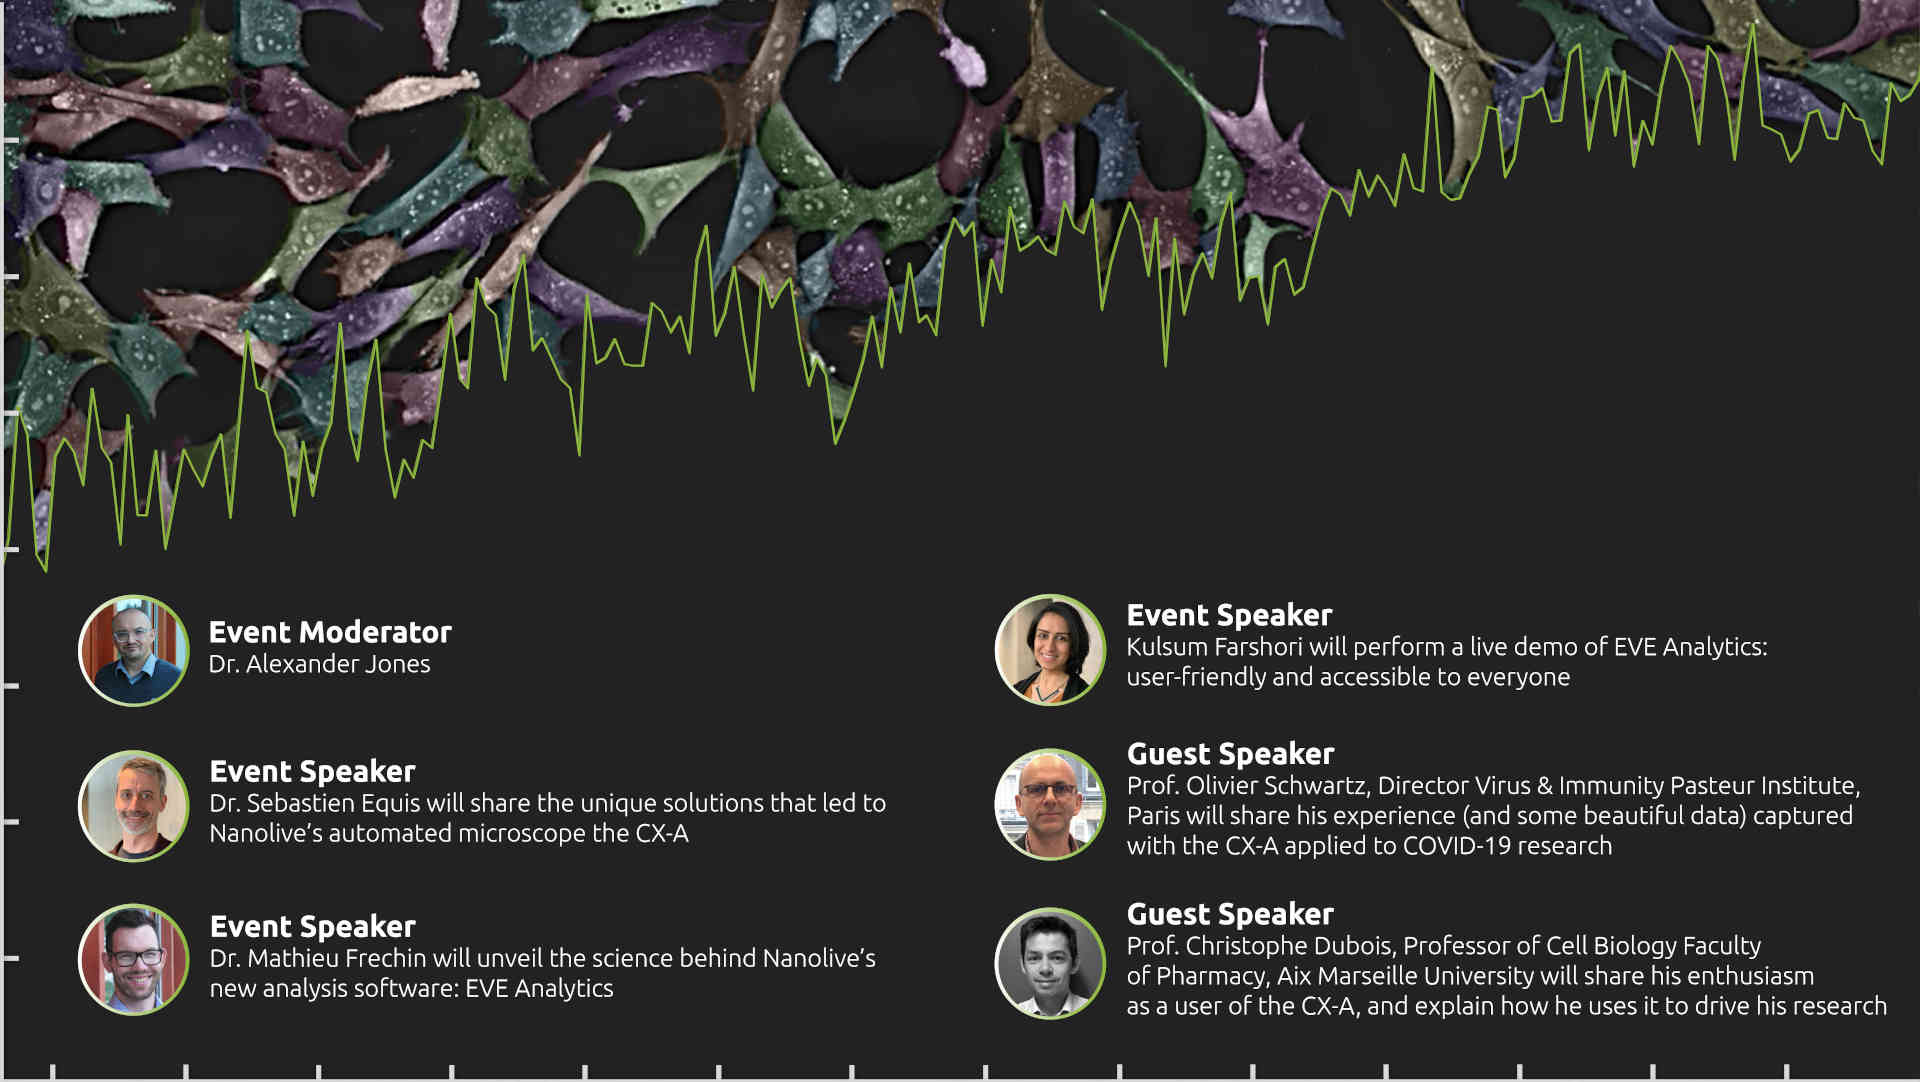
Watch a detailed presentation of ca. 50 mins of EVE Analytics, that was prepared for our launch event in March 2021. Our expert speakers introduce the technology and the science behind the analysis software EVE Analytics and showcase the software during a demonstration. The presentation is wrapped up by two guest speakers: Prof. Oliver Schwartz (Pasteur Institute Paris) and Prof. Christophe Dubois (University Aix Marseille).
Webinar “Increase biological relevance and simplify your discovery workflow”
In this webinar, Dr. Emma Gibbin-Lameira, Communications Specialist at Nanolive:
- A step-by-step guide to setting-up an experiment and acquiring images with Nanolive’s automated microscope the 3D Cell Explorer 96focus, and creating publication-ready data and images using Nanolive’s new quantification solution, EVE Analytics
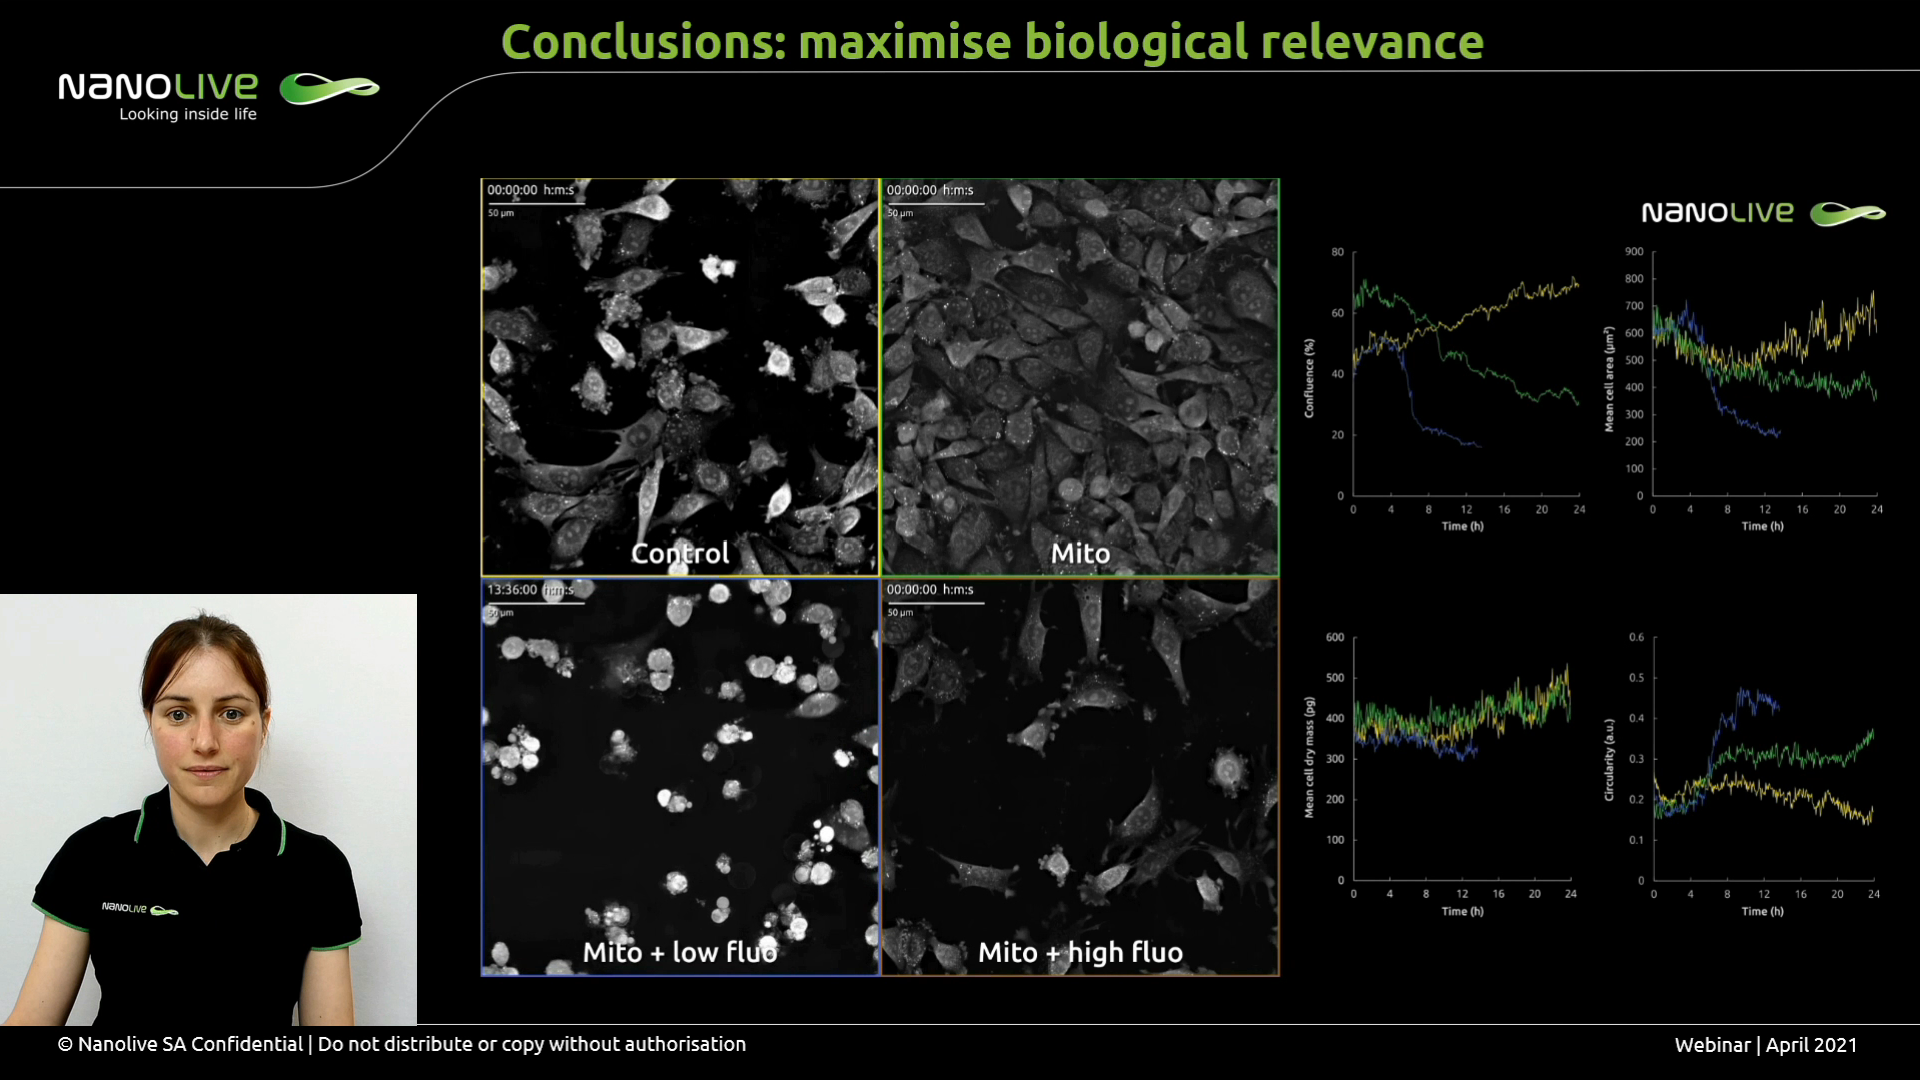
- A case study showing how different stress stimuli (cytotoxicity vs. phototoxicity) invoke different types of cell death
- An in-depth discussion of how cell metrics can be used to quantify different types of cell deathPlease register here to view the webinar on-demand
Nanolive imaging and analysis platforms
Swiss high-precision imaging and analysis platforms that look instantly inside label-free living cells in 3D
3D CELL EXPLORER 96focus
Automated label-free live cell imaging and analysis solution: a unique walk-away solution for long-term live cell imaging of single cells and cell populations
3D CELL EXPLORER-fluo
Multimodal Complete Solution: combine high quality non-invasive 4D live cell imaging with fluorescence
3D CELL EXPLORER
Budget-friendly, easy-to-use, compact solution for high quality non-invasive 4D live cell imaging

