Introduction: characterization of single cells
Phenotypic variation exists even in clonal cell populations that are derived from a single ancestral cell [1]. Such variation is interesting from a medical perspective as it can create subsets of the population that behave differently compared to others (e.g. some cells may develop resistance to drugs [2]). Quantifying dynamic changes in variation and thus, cell fate, requires individual cells to be tracked at high spatial and temporal resolution.
Some live cell imaging techniques (e.g. high content imaging) do allow to track individual cells through time, but they also require cells to be fluorescently-labelled, which generates phototoxicity, imposing limitations on either the duration of the experiment, or the frequency of imaging during an experiment.
Nanolive imaging is not fluorescence-based, which avoids these limitations. Our microscopes measure the cells refractive index [3], an intrinsic material property of the cell. This permits to monitor cells at high frequency for unlimited periods of time, without compromising spatial resolution. This is advantageous as it allows to follow the state, behaviour, phenotype and function of single cells at the population level.

In the Feature Application entitled Characterizing Single Cells, we showcase the enormous potential that Nanolive live cell imaging holds for single cell characterization. In the first case study, we analyze micro-heterogeneity at the population and the temporal level in unperturbed cells. We present this case here below. The following case studies can be accessed downloading the application note document here.
We hope this application note will inspire researchers to revolutionize their research using Nanolive cell imaging and improve single cell analyses by capturing the full complexity of time-varying cell states and the interconnectedness of cell subsets within a population context.
Background: phenotypic variation
Phenotypic variation is a ubiquitous feature of all biological systems. It underpins complex, dynamic systems (e.g. immune responses) and biological processes (e.g. stem cell differentiation). Measuring changes in heterogeneity requires multiplex imaging platforms that maintain high spatial and temporal resolution, like Nanolive’s CX-A. Here, we provide the first quantitative analysis of phenotypic variability of single cells in a population of unperturbed cells.
Experimental approach: how to image single cells using Nanolive live cell imaging solutions?
An unperturbed population of 3T3-derived pre-adipocyte cells were imaged for 90 h using the 10×10 grid-scan mode on Nanolive’s CX-A (one image taken every 8.5 mins; for details, see Video 1 and Image 1). Resulting images were subjected to a maximum intensity Z-projection, segmented and quantified using protocols developed in house.
Video 1
Unperturbed 3T3-derived pre-adipocyte cells label-free live cell imaging for 90h. Confluence increased ten-fold over the course of the experiment from 6% (74 cells) at the start of the experiment, to 60% (521 cells) at the end.

Image 1
Unperturbed 3T3-derived pre-adipocyte cells label-free live cell imaging for 90h: original refractive index images, and corresponding segmentation masks and cell count and confluence graphs. Confluence increased ten-fold over the course of the experiment from 6% (74 cells) at the start of the experiment, to 60% (521 cells) at the end.
1. Visualizing phenotypic variability at the population level
Six metrics (cell area, perimeter, compactness, extent, dry mass, and granularity) were calculated for each cell, at every time point (150650 cells). The resulting data was visualized as relative frequency histograms, which measure the micro-heterogeneity in a population and allow to compare the variance that exists between traits. Cell area (A), compactness (B), and dry mass (C), are shown in Video 2.
Observations
All traits were highly variable and positively skewed. This could be an artefact of the analysis as time is unaccounted here. More complex statistical models could be used to compare histogram distributions over time, or to calculate the relative contribution of each trait to the observed phenotype.
Video 2
Unperturbed 3T3-derived pre-adipocyte cells label-free live cell imaging for 90h. Cell area, compactness and dry mass.
2. Analyzing the temporal response of single cells
The data can also be used to examine the response of large populations of cells over time. The graphs in Image 2 show cell extent and compactness over time, first as line graphs showing the mean ± standard error (SE) and then as the co-efficient of variation (CV).

Image 2
Quantification of the extent, compactness, and coefficients of variation of both measures for the dataset of unperturbed population of 3T3-derived pre-adipocyte cells images for 90h.
Observations
A 31% reduction in average extent was observed over the first 48 h, but a steady increase was observed over the second half of the experiment (A). The opposite pattern was observed in average compactness (B). Interestingly, the variability of the two traits is reduced over time as is exemplified by the tapering of the SE (A, B) and the reduction in CV (C, D).
3. What causes phenotypic variation at the population level?
The causes of micro-heterogeneity can be separated into intrinsic and extrinsic factors. Intrinsic factors refer to biological noise, while extrinsic factors are related to spatial inequalities or cell-cell/cell-matrix interactions in the environment surrounding the cell [4,5]. To test whether the variation we observed at the population level is driven by intrinsic or extrinsic factors, we compared cells at the population level (i.e. where extrinsic factors change as a function of confluence) with that of isolated single cells (i.e. where extrinsic factors are stable)*. Coloured outlines relate to colours in the histograms (for details, see Video 3 and Image 3).
*Unperturbed individual pre-adipocyte cells were imaged in a separate set of experiments, for 1 h using the 3D Cell Explorer-fluo (one image taken every 6 secs).
Video 3
Measures of area, compactness and dry mass in unperturbed individual pre-adipocyte cells imaged in a separate set of experiments, for 1 h using the 3D Cell Explorer-fluo (one image taken every 6 secs).

Image 3
Measures of area, compactness and dry mass in unperturbed individual pre-adipocyte cells imaged in a separate set of experiments, for 1 h using the 3D Cell Explorer-fluo (one image taken every 6 secs).
Observations
Although phenotypically different, isolated single cells are less variable than cells at the population level (A, B, C), which suggests variability at the population level is influenced by extrinsic factors, most likely cell crowding, as cells must adapt to an increasingly limited space. This approach provides a means of testing the mechanistic basis of phenotypic variability.
References
[1] Geiler-Samerotte KA et al. Curr. Opin. Biotech. 24(4):752-9 (2013)
[2] Bishop AL et al. Mol. Microbiol. 63, 507-520 (2007)
[3] Cotte Y et al. Nat. Photonics. 7(2):113-7 (2013)
[4] Sun, X.X. & Yu, Q. Acta Pharmacol. Sin, 36(10), 1219-1227 (2015)
[5] Jahn M. et al. Curr. Opin. Microbiol. 1;25:49-55 (2015)
Read our latest news
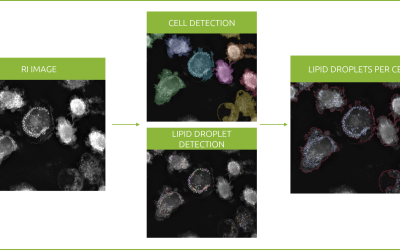
Revolutionizing lipid droplet analysis: insights from Nanolive’s Smart Lipid Droplet Assay Application Note
Introducing the Smart Lipid Droplet Assay: A breakthrough in label-free lipid droplet analysis Discover the power of Nanolive's Smart Lipid Droplet Assay (SLDA), the first smart digital assay to provide a push-button solution for analyzing lipid droplet dynamics,...
Food additives and gut health: new research from the University of Sydney
The team of Professor Wojciech Chrzanowski in the Sydney Pharmacy School at the University of Sydney have published their findings on the toxic effect of titanium nanoparticles found in food. The paper “Impact of nano-titanium dioxide extracted from food products on...
2023 scientific publications roundup
2023 has been a record year for clients using the Nanolive system in their scientific publications. The number of peer-reviewed publications has continued to increase, and there has been a real growth in groups publishing pre-prints to give a preview of their work....
Nanolive microscopes
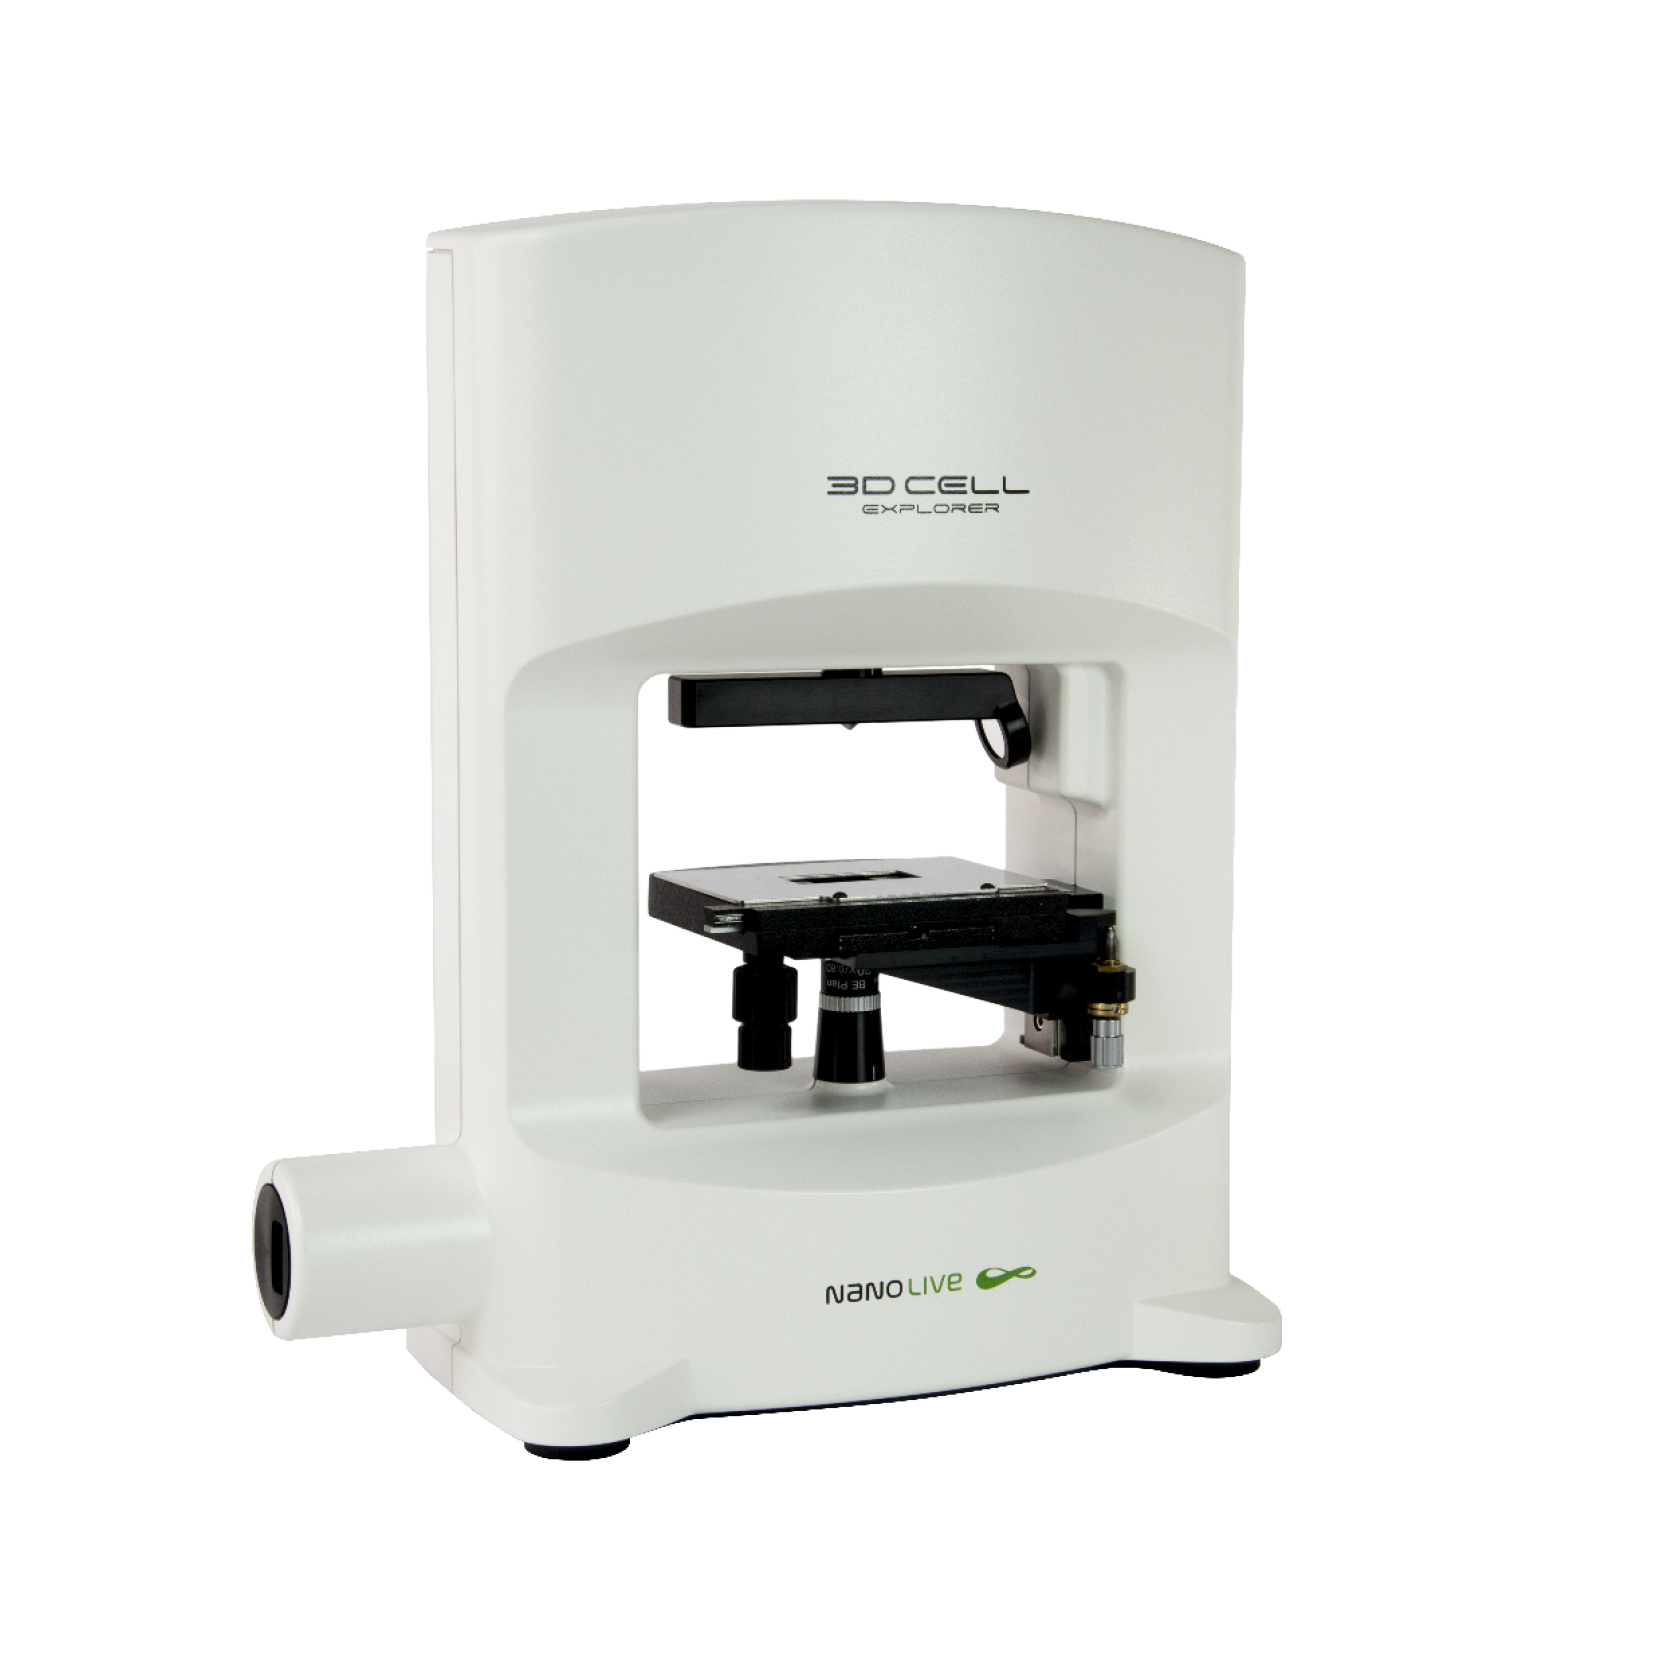
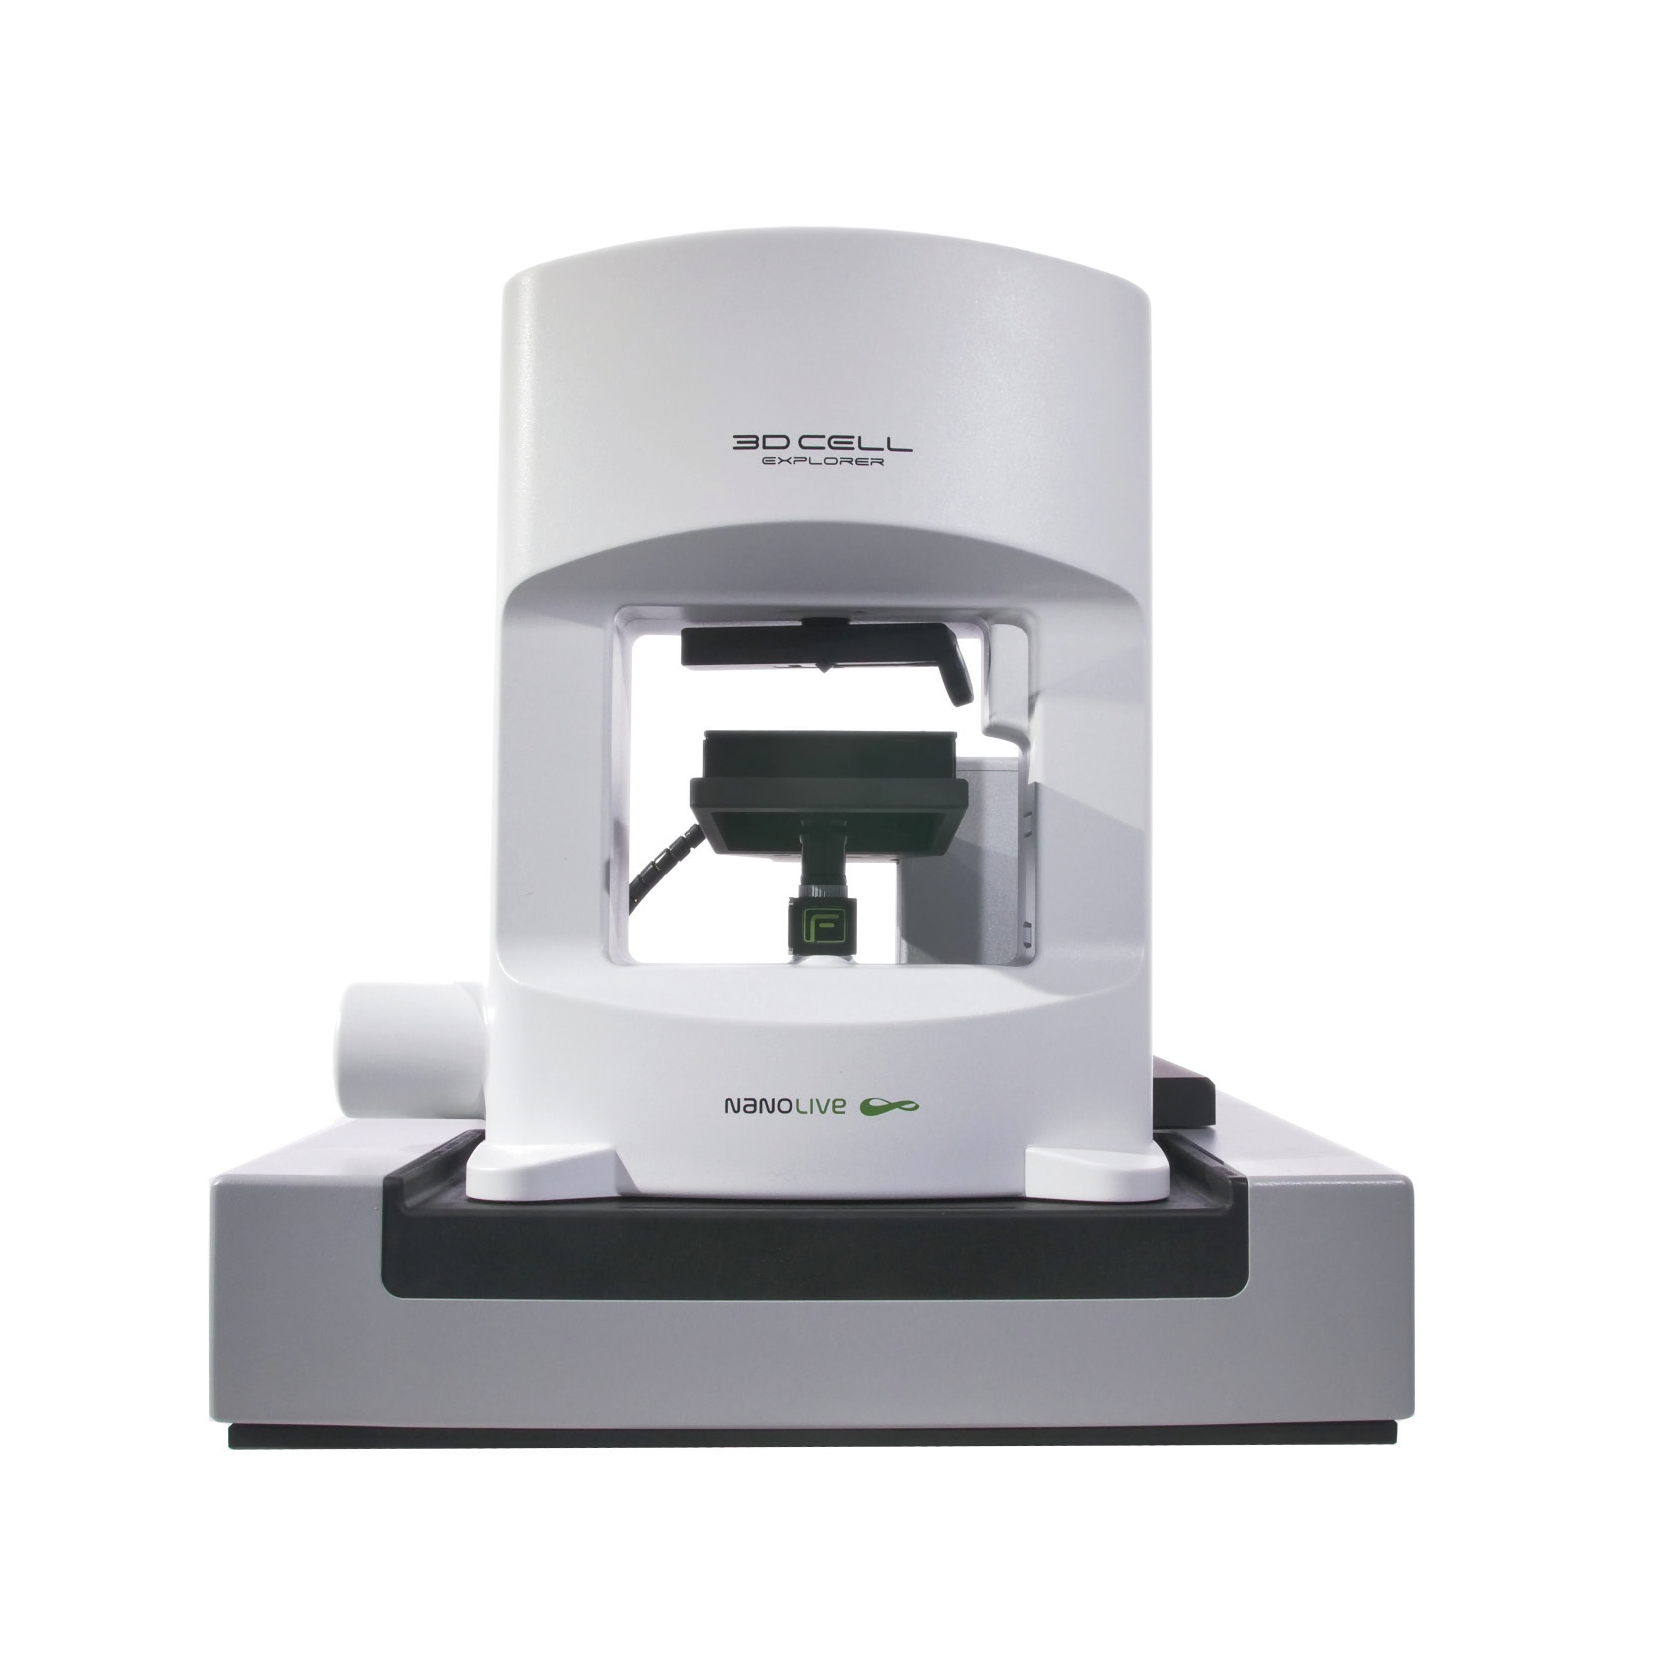
3D CELL EXPLORER
Budget-friendly, easy-to-use, compact solution for high quality non-invasive 4D live cell imaging
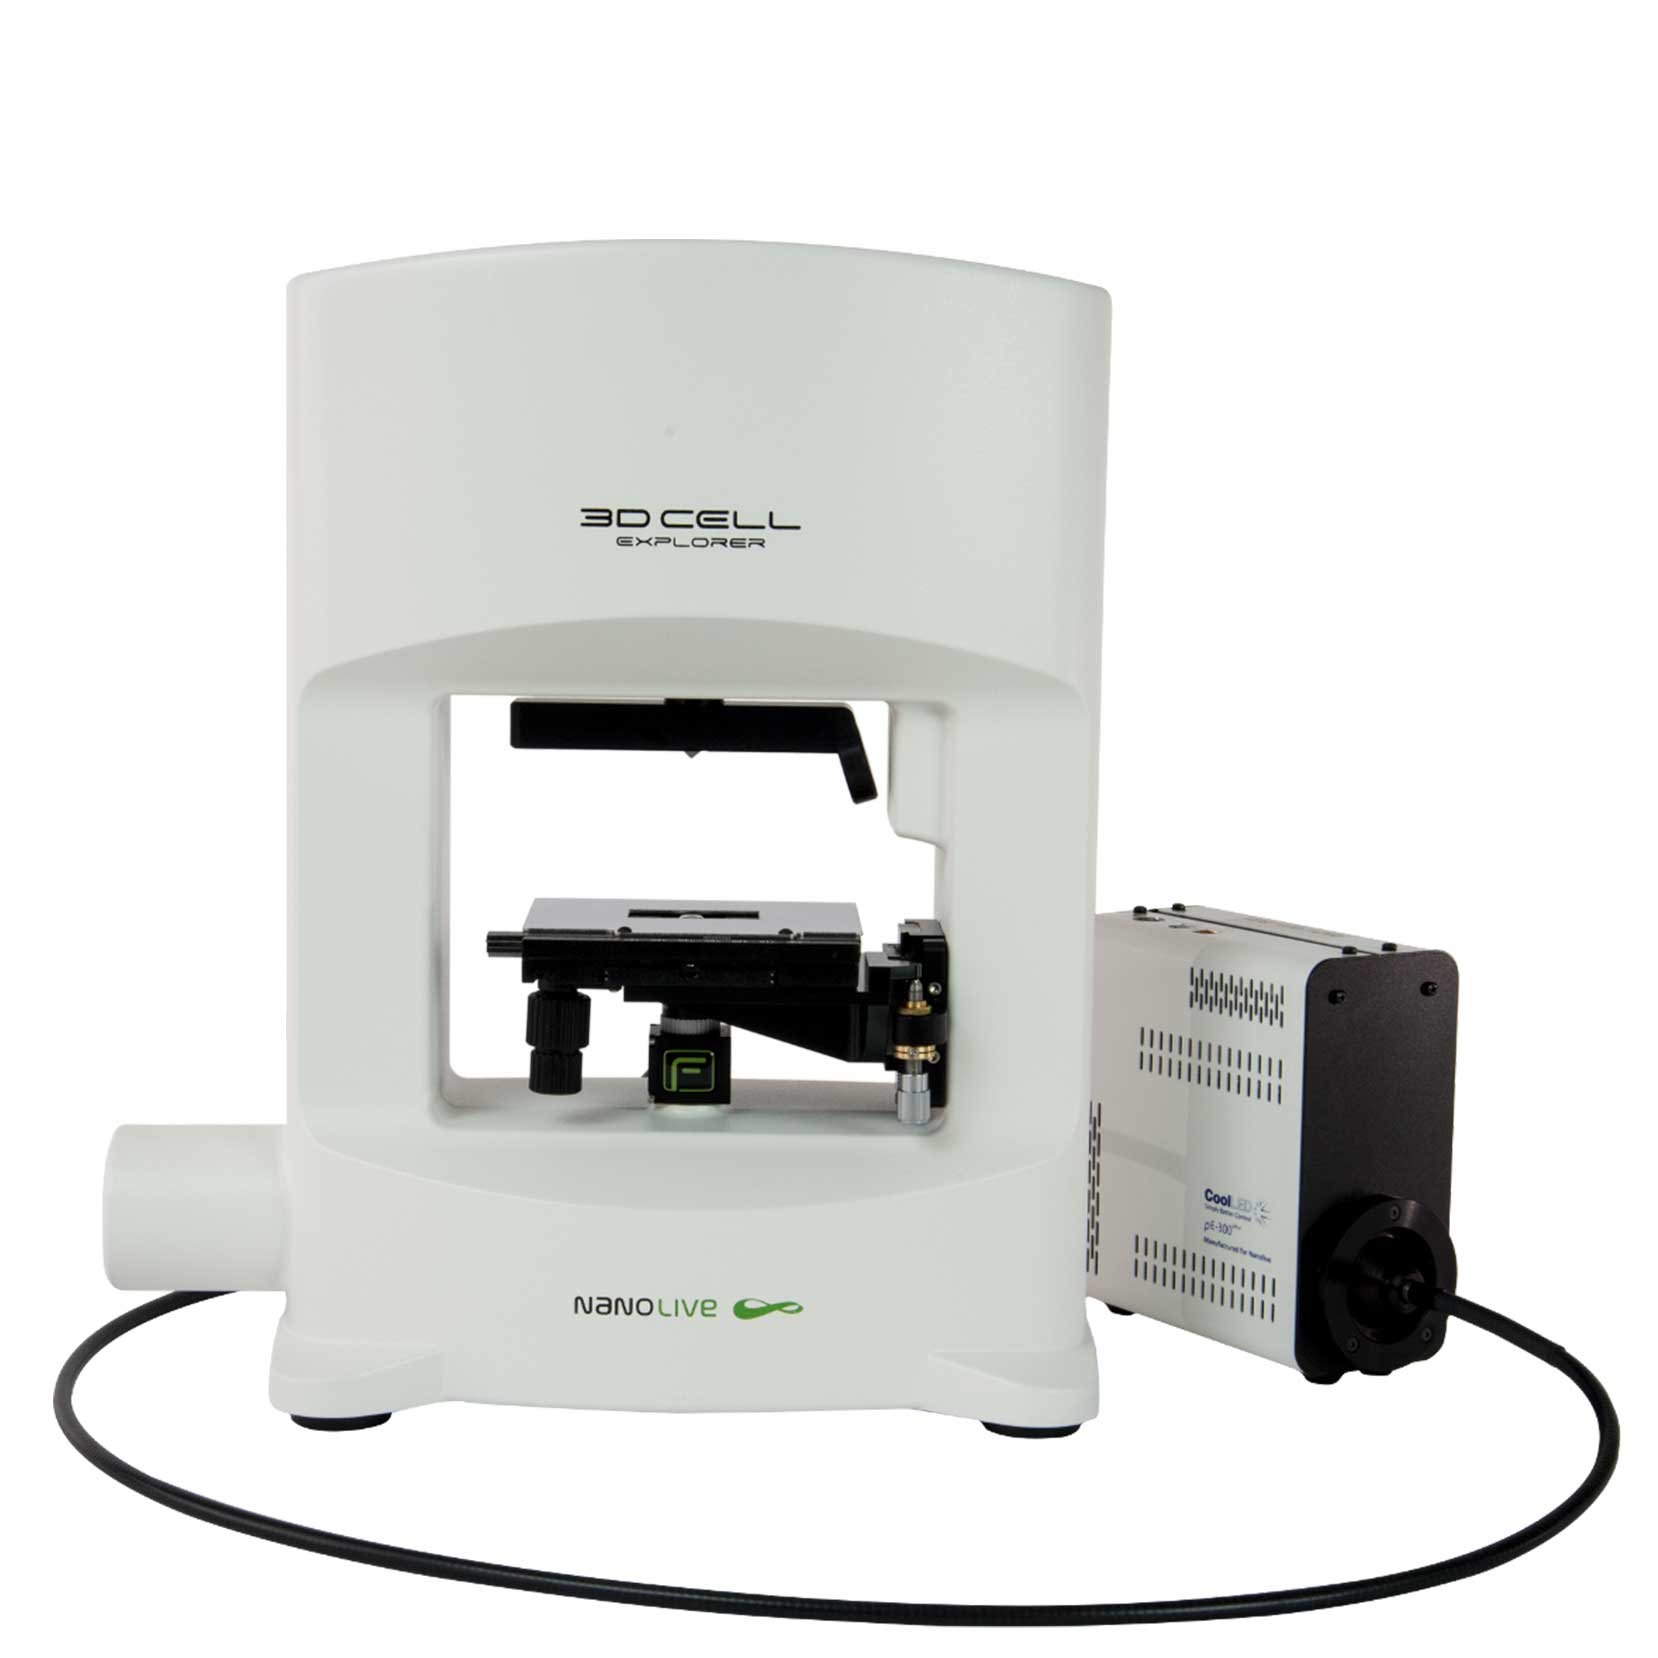
3D CELL EXPLORER-fluo
Multimodal Complete Solution: combine high quality non-invasive 4D live cell imaging with fluorescence
CX-A
Automated live cell imaging: a unique walk-away solution for long-term live cell imaging of single cells and cell populations