Background
In this case study, we expose cells to inhibitors or modulators of kinase activity and observe how the cells respond. Hyperactivity, malfunction or overexpression of kinases is the root cause of many human cancers, and so the development of kinase inhibitors targeting specific pathways has generated great interest as an anti-cancer treatment.
Experimental approach
8 inhibitors or modulators of kinase activities were tested targeting: Akt, JNK, CDK2, RTK, PKA, JAK, mTOR and AMPK (see Figure 1). Two experimental screens were conducted: the first used 3T3-derived pre-adipocyte cells, and the second used LN71 glioblastoma cells. Cells were plated on fibronectin-covered 96-well plates, in serum-free conditions. Inhibitors were used at 0.1, 1 and 5 times the recommended working concentrations. Images were taken using the automated 3×3 gridscan mode, at an acquisition rate of 1 scan every 25 mins, for 40 h. After, images were stitched in FIJI, and segmented and analysed using tools developed in house.
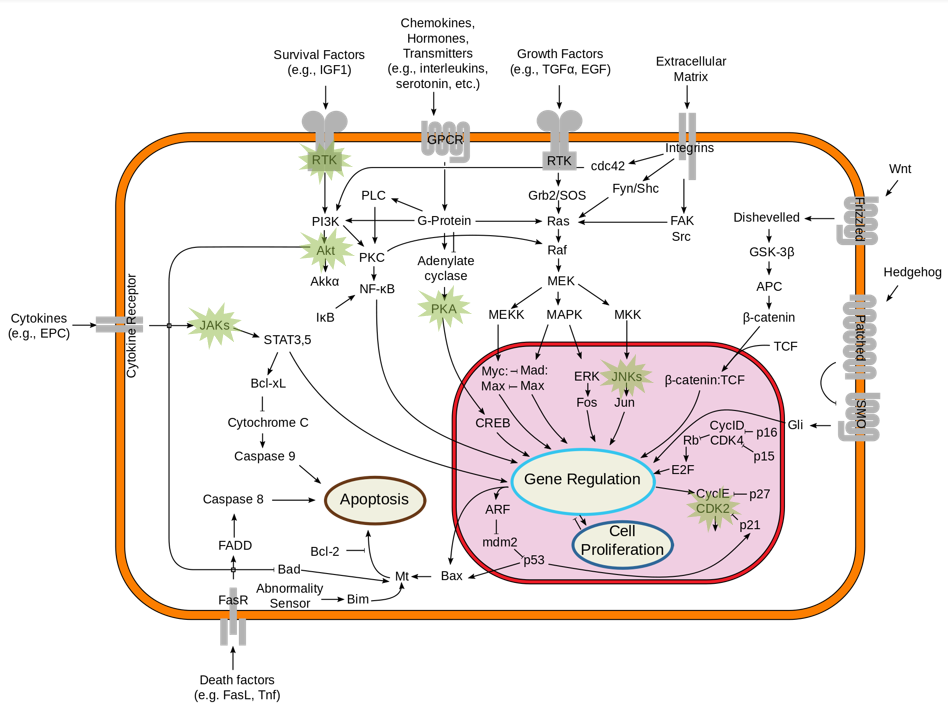
Figure 1. Targeted kinases
Quantify changes in population dynamics
Video 1. JNK inhibitor effect in pre-adipocytes compared to negative control
- With Nanolive cell imaging it is possible to quantify the proliferation or decline of cells in a statistically robust manner that inspires data confidence.
- In Video 1, we observe cell numbers in the control (green) increase throughout the experiment. In contrast, JNK-inhibited cells (orange) remained stable throughout.
- The JNK pathway controls apoptosis and so we expected cell death to be avoided when this pathway is inhibited.
Detect modifications in lipid droplet usage
Nanolive imaging is the only label-free way to visualize lipid droplets (LDs). The absence of LDs allows to detect when LD reserves have been metabolized. In this experiment, cells were cultured in serum-free conditions (essentially starved). No LDs were present in the negative control (green) after 30 h; non-perturbed cells metabolize their LD reserves. In contrast, JNK (orange) and CDK2 (not shown) inhibited cells still have LDs at the end of the experiment, showing these treatments modify their metabolism.
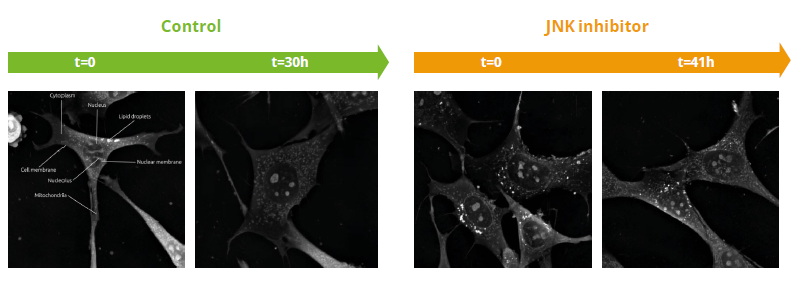
Figure 2. Lipid droplet usage in negative control and JNK inhibitor in pre-adipocytes
Measure differences in cell metrics
Video 2. mTOR inhibitor effect in pre-adipocytes compared to negative control
- It is also possible to quantify differences in cell metrics including cell area, perimeter, extent, compactness, and dry mass.
- In Video 2, we compare the difference in average cell size between control (green) and mTOR-inhibited cells (orange). mTOR-inhibited cells were larger than in the control.
- mTOR is a key regulator of cell growth and Inhibiting mTOR reduced cell division, but increased cell size.
Visualize nuclear changes
- CDK2 drives the progression of cells into the S- and M-phases of the cell cycle.
- Inhibiting CDK2 caused severe nuclear disruption. Nuclear membranes were notably thicker than in the control and nucleoli were clearly disorganized structurally.
- Cells did divide when CDK2 was inhibited but the process was abnormal.
Video 3. CDK2 inhibitor effect in pre-adipocytes
Identify different drug-induced pathologies
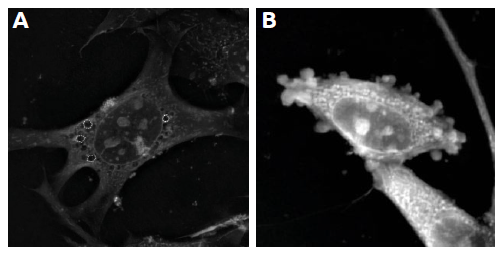
Figure 3. Drug-induced pathologies
- mTOR-inhibition was the only treatment to cause the formation of autophagic vacuoles (see Figure 3, A).
- Some cells in other treatments e.g. JNK, JAK and CDK2 showed the characteristic signs of apoptosis (i.e. membrane blebbing/apoptotic bodies; Figure 3, B).
Modifications in mitochondrial form/localization
- The high resolution of Nanolive cell imaging makes it possible to detect changes in the form and distribution of mitochondria in a cell.
- Mitochondria typically cluster around the nucleus, but CDK2-inhibition re-distributed them throughout the cell (Figure 4, A), with increasing densities present in the lamellipodia (Figure 4, B).
- The rounded morphology that mitochondria display towards the end of the experiment (Figure 4, C) shows that CDK2-inhibition clearly perturbs mitochondrial morphology.
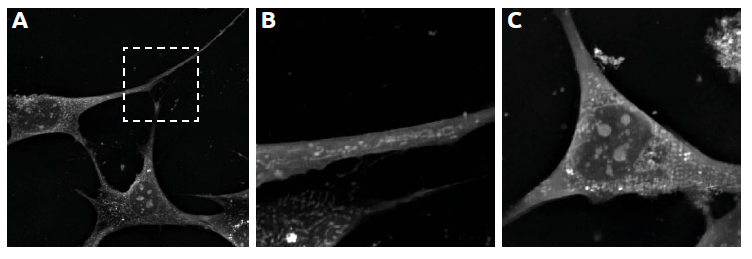
Figure 4. Modifications in mitochondrial form / localization
Compare the morphological responses of cells to kinase inhibition
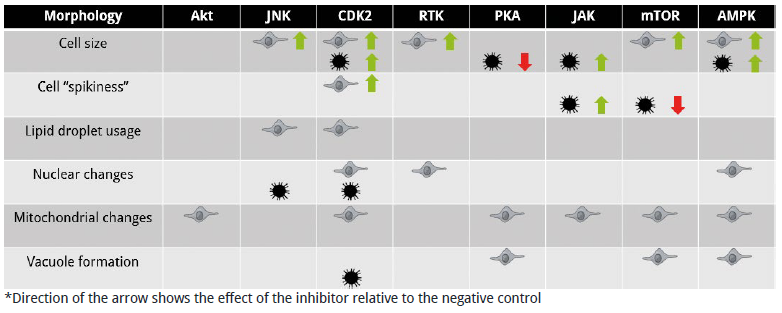
Figure 5. Comparison of the morphological responses of cells to kinase inhibition
- Glioblastoma cells are much more resistant to kinase inhibition than pre-adipocyte cells.
- Drug-induced phenotypic responses can be cell-specific. PKA for example, reduces cell size in cancer cells relative to the control, but not in pre-adipocyte cells.
In conclusion, Nanolive imaging:
-
- Accelerates data collections thanks to automated, label-free imaging
- Reports the real response of cells to a drug rather than the response of cells to method perturbation (e.g. phototoxicity), inspiring confidence in data
- Produces continuous data that allows temporal resolution of cellular responses
- Validates functions in a quantitative, unbiased manner
- Permits novel observations because of its capacity to capture multiple biological processes simultaneously
Read our latest news

Cytotoxic Drug Development Application Note
Discover how Nanolive’s LIVE Cytotoxicity Assay transforms cytotoxic drug development through high-resolution, label-free quantification of cell health and death. Our application note explores how this advanced technology enables real-time monitoring of cell death...

Investigative Toxicology Application Note
Our groundbreaking approach offers a label-free, high-content imaging solution that transforms the way cellular health, death, and phenotypic responses are monitored and quantified. Unlike traditional cytotoxicity assays, Nanolive’s technology bypasses the limitations...

Phenotypic Cell Health and Stress Application Note
Discover the advanced capabilities of Nanolive’s LIVE Cytotoxicity Assay in an application note. This document presents a detailed exploration of how our innovative, label-free technology enables researchers to monitor phenotypic changes and detect cell stress...
Nanolive microscopes
3D CELL EXPLORER
Budget-friendly, easy-to-use, compact solution for high quality non-invasive 4D live cell imaging
3D CELL EXPLORER-fluo
Multimodal Complete Solution: combine high quality non-invasive 4D live cell imaging with fluorescence
CX-A
Automated live cell imaging: a unique walk-away solution for long-term live cell imaging of single cells and cell populations