Introduction
Dose-response curves provide important pharmacodynamic properties (efficacy, potency, toxicity, and lethality) for evaluating the performance of candidate drugs in the discovery pipeline. Half maximal effective concentration (EC50) values are a standard indicator of drug potency, but recent studies have raised concerns about the robustness and reproducibility of EC50 values generated using current methods, with highly variable values often observed between and within labs.
EC50 values are calculated from dose-dependent cell death assays. Most current studies use luminometric or fluorometric cell death assays (e.g., ATP, 5-DFDA-AM); fluorescence-based lytic end-point techniques that are problematic for many reasons. Firstly, multiple experiments are needed to cover all the concentrations and time points (a time consuming and costly process in terms of labour, reagents, and cells) and secondly, the use of fluorescence introduces cytotoxic/cytostatic effects into the results via the addition of the dye, or by phototoxicity-induced cell stress. The only way to produce 100 % artefact-free EC50 values is by using label-free imaging.
The non-invasive nature of label-free imaging means cells can be continuously monitored, over infinite periods of time, which means kinetic EC50 values can also be calculated. Time-dependent EC50 values provide information about drug stability; whether a drug’s potency increases or decreases over time.

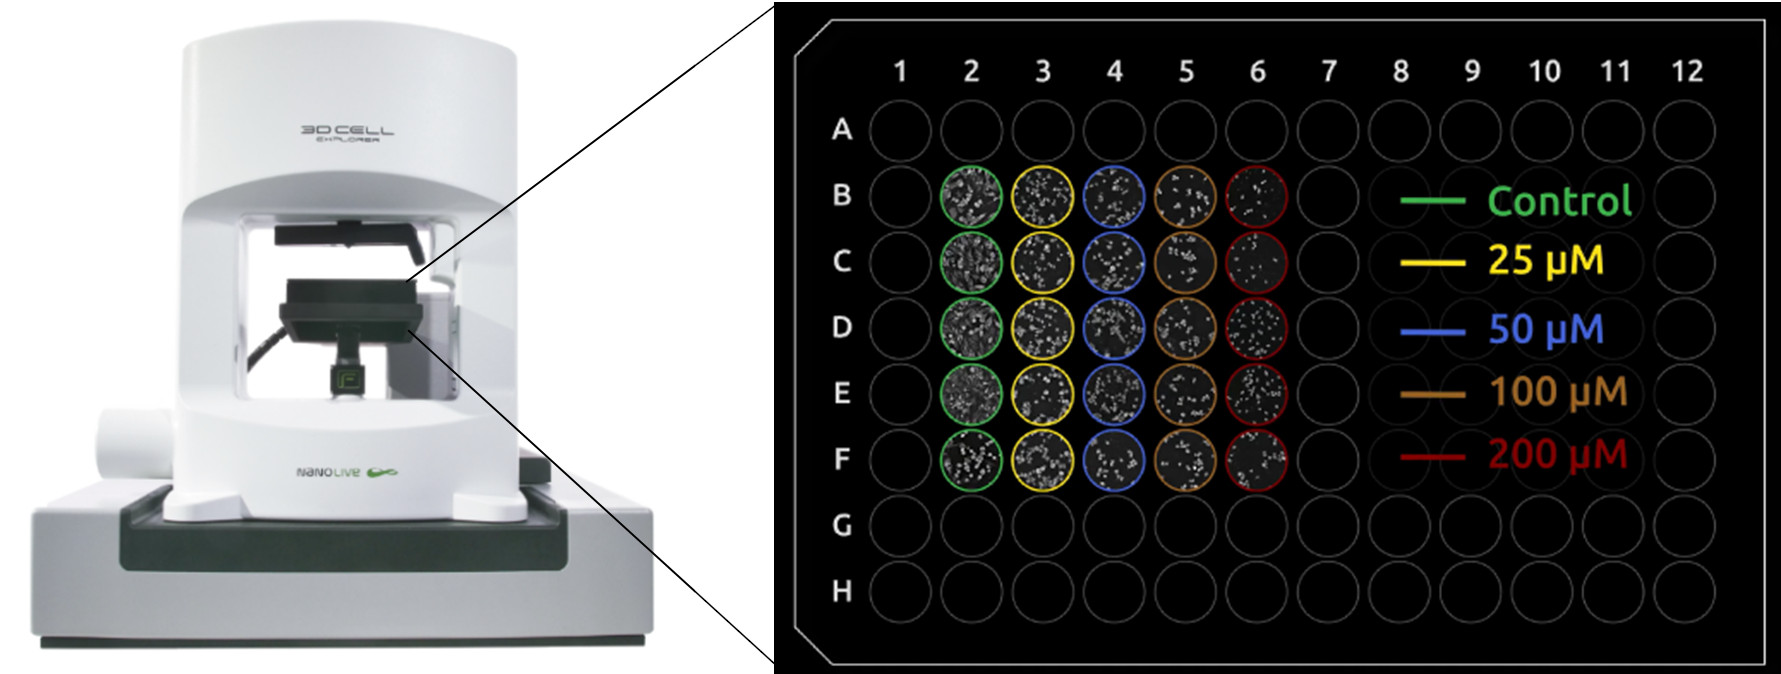
The CX-A pictured with a 96-well plate showing the experimental setup used in this case study.
Case study one: calculating the kinetic EC50 of Chloroquine
Just before acquisition the DIC-lid was removed and 40 µL of pre-warmed serum-free DMEM + 1 % pen-strep + treatment was added to the well to produce a final working volume of 80 µL. Treatments in this case were control (i.e., no drug), 25 µM, 50 µM, 100 µM, and 200 µM Chloroquine (n = 5, Fig. 1). After the DIC-lid was replaced, the environmental chamber was closed, and the plate was left to thermalize for 10-15 mins.
Images were taken using the 3×3 gridscan mode (a field of view of approx. 275 µm2) of Nanolive’s CX-A. Images were acquired for 60 h using the maximum acquisition mode (one image every 15 mins per well; Fig. 2). The environmental chamber was refilled with 6 mL of water every 24 h to maintain stable humidity throughout the experiment.
Read our latest news
Cytotoxic Drug Development Application Note
Discover how Nanolive’s LIVE Cytotoxicity Assay transforms cytotoxic drug development through high-resolution, label-free quantification of cell health and death. Our application note explores how this advanced technology enables real-time monitoring of cell death...
Investigative Toxicology Application Note
Our groundbreaking approach offers a label-free, high-content imaging solution that transforms the way cellular health, death, and phenotypic responses are monitored and quantified. Unlike traditional cytotoxicity assays, Nanolive’s technology bypasses the limitations...
Phenotypic Cell Health and Stress Application Note
Discover the advanced capabilities of Nanolive’s LIVE Cytotoxicity Assay in an application note. This document presents a detailed exploration of how our innovative, label-free technology enables researchers to monitor phenotypic changes and detect cell stress...


