Cytotoxicity
Label-free digital analyses for cell health, stress, death & recovery Request a quote or demoNanolive’s live cell imaging can be used to differentiate between cytotoxic conditions and drug candidates label-free. The LIVE Cytotoxicity Assay uses machine learning to automatically quantify and monitor cell health and death kinetics, and is able to identify apoptosis and necrosis simultaneously, without markers. Combining this AI-powered digital assay with fluorescent labelling enables monitoring of cell death for different cell lines in co-culture, allowing for more biologically relevant in vitro experiments. Read on to discover applications including cytotoxic drug candidate screening in a 96-well plate, increasing understanding of therapy resistance, and even detecting cells recovering from cell death.
LIVE Cytotoxicity Assay
The first push-button and automated solution for profiling cell health, death, apoptosis and necrosis of different cell lines and subpopulations in co-culture, label-free.
Monitoring different types of cell death, label-free
Cells were incubated at 42 degrees Celsius on the imaging stage incubator during imaging to induce heat shock and measure the cellular response. We start to see morphological changes as cells contract and some lose contact with their neighbours. The Health Cell Index of the cell population registered an initial decrease before stabilising at ~85. This was mirrored by a low rate of cell death.
After 15 hours, the Health Cell Index sharply decreased as most cells began to show signs of stress and the death rate began to increase again. 3T3 preadipocytes incubated at 42°C during imaging, imaged every 00:01:45 for 20:25:00.
Compare death kinetics for different cell lines in
co-culture
The LIVE Cytotoxicity Assay combines our AI-powered digital analysis with fluorescent labelling for the first time to monitor the responses of different cell lines and subpopulations in co-culture simultaneously. This allows for more biologically relevant in vitro experiments that more accurately represent the in vivo condition, meaning improved translatability of data to the clinical stage.
Kinetic EC50 Calculation with EVE Analytics
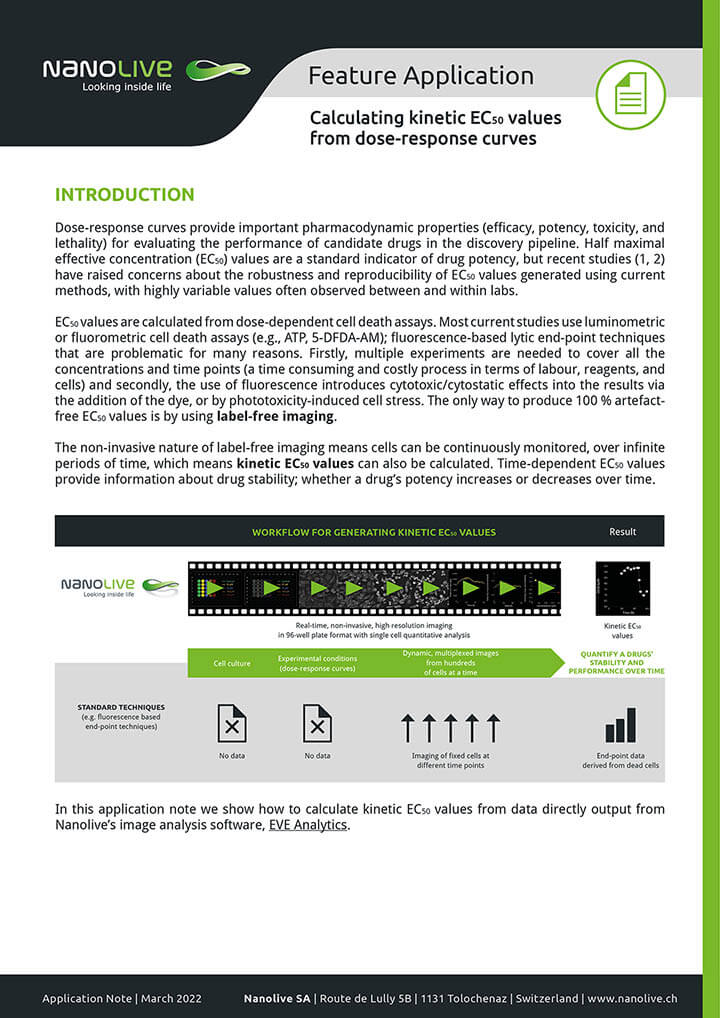
Dose-response curves provide important pharmacodynamic properties (efficacy, potency, toxicity, and lethality) for evaluating the performance of candidate drugs in the discovery pipeline. Half maximal effective concentration (EC50) values are a standard indicator of drug potency, but the robustness and reproducibility of EC50 values generated using current methods is low.
The non-invasive nature of label-free imaging means cells can be continuously monitored, over infinite periods of time, which allows kinetic EC50 values to be calculated. Kinetic EC50 values provide information about a drug’s stability; whether a drug’s potency increases or decreases over time.
Webinar
Watch our Webinar: Explore detailed use-case data from our key opinion leaders, analysed by the LIVE Cytotoxicity Assay & LIVE T Cell Assay
Watch our Webinar: How to calculate kinetic EC50 values with EVE Analytics
In this webinar, we present the following use-cases of our immuno-oncology and cytotoxicity assays from industry-leading biopharma companies to test toxicity, selectivity, uptake and expression of different targeted therapies.
Specifically:
- Immune cell therapeutics:
- Bispecific antibody screening in a T cell-target cell co-culture (Lightchain Bioscience)
- Drug selectivity and cytotoxicity:
- mRNA expression and cytotoxicity (TrON)
- Drug selectivity in co-cultures: senolytics (dsm-firmenich)
- Measuring particle uptake (bit.bio)
In this webinar, Dr. Emma Gibbin-Lameira shows how Nanolive’s label-free, non-invasive imaging can be used to quantify dose-dependent responses of HeLa cells to Chloroquine.
Specifically, Dr. Gibbin-Lameira shows that:
- Dose-dependent experiments can be performed in 96-well plate format over long periods of time (> 2 days), reducing the need for time and labor-intensive multiple fixed-point measurements and eliminating cytotoxic/cytostatic effects arising from the use of labels, dyes, or phototoxic damage
- Metrics output from Nanolive’s proprietary software, EVE Analytics, can be used to generate statistically robust time-dependent EC50 values based on total dry mass; a metric unique to label-free imaging
- Sub-cellular spatial resolution combined with high content image analysis can be used to investigate a drugs’ mechanism of action
Sign up to watch the webinar:
Sign up to watch the webinar:
Application Note: How to calculate kinetic EC50 values
In this application note we show how to calculate kinetic EC50 values from data directly output from Nanolive’s image analysis software, EVE Analytics.
Nanolive imaging and analysis platforms
Swiss high-precision imaging and analysis platforms that look instantly inside label-free living cells in 3D

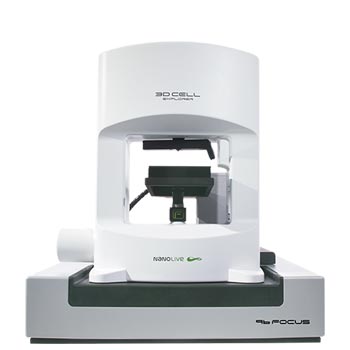
3D CELL EXPLORER 96focus
Automated label-free live cell imaging and analysis solution: a unique walk-away solution for long-term live cell imaging of single cells and cell populations

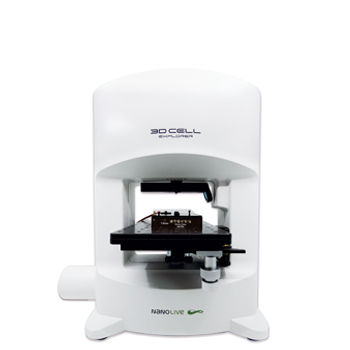
3D CELL EXPLORER-fluo
Multimodal Complete Solution: combine high quality non-invasive 4D live cell imaging with fluorescence

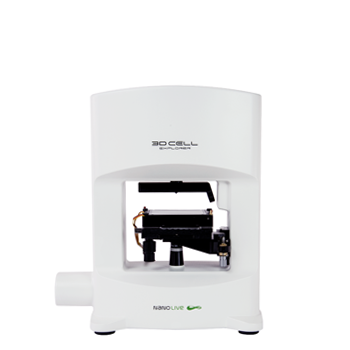
3D CELL EXPLORER
Budget-friendly, easy-to-use, compact solution for high quality non-invasive 4D live cell imaging

