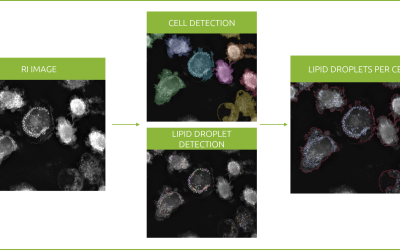
Objective: cell segmentation in EVE Analytics
Nanolive’s label-free technology makes it possible to image cells for long periods of time, at high temporal resolution. The quantity and complexity of the images generated allows us to visualize biological processes in unprecedented detail, but also magnifies the challenges associated with image analysis. Manual image registration and analysis is impossible and so computer-aided processing must be used to harness data complexity (1). In this technical note, we introduce the key elements involved in cell segmentation, which are essential to understand the novelty of EVE Analytics (EA), Nanolive’s software solution for quantitative cell analysis. We then evaluate the performance of EA segmentation against fluorescence-based segmentation and compare how metrics produced by both approaches differ.
How are cell metrics impacted?
EA automatically calculates numerous cell metrics. Here we compare cell area, perimeter, compactness, and extent calculated using EA (green) and compare them to the values generated by low Draq5 and Cell traceviolet (D+C) conditions (orange). In addition, we report one novel cell metric: dry mass, and exploit the full potential of a texture measurement called granularity, which are unique advantages of Nanolive imaging.

How are cell metrics impacted?
Comparison between values generated by low D+C conditions (orange) and EVE Analytics values (green) for the metrics cell area, perimeter, compactness and extent. Examples of dry mass and granularity.
Observations
- The first striking observation is that the EA captures much greater cell-to-cell variability, as is demonstrated by the large interquartile spread of single cells values at each time point. This is of crucial importance as cell-to-cell variability reflects biological processes at work (2).
- The second fundamental observation concerns the inverse trends in compactness and extent. The values produced by the fluo-segmentation suggest cells are well spread (and by deduction healthy) but we know from the images that this is far from the case. In comparison, the values quantified using EA accurately reflect the stress the cells are experiencing.
- The final two plots represent metrics that are either inaccessible (dry mass) or that make little sense (granularity) using fluo-segmentations, further reinforcing the advantages of using EA.
References
[1] Meijering, E. IEEE Signal Process. Mag. 29, 140-145 (2012).
[2] Frechin M. et al. Nature 523, 88-91 (2015)
Read our latest news
Revolutionizing lipid droplet analysis: insights from Nanolive’s Smart Lipid Droplet Assay Application Note
Introducing the Smart Lipid Droplet Assay: A breakthrough in label-free lipid droplet analysis Discover the power of Nanolive's Smart Lipid Droplet Assay (SLDA), the first smart digital assay to provide a push-button solution for analyzing lipid droplet dynamics,...
Food additives and gut health: new research from the University of Sydney
The team of Professor Wojciech Chrzanowski in the Sydney Pharmacy School at the University of Sydney have published their findings on the toxic effect of titanium nanoparticles found in food. The paper “Impact of nano-titanium dioxide extracted from food products on...
2023 scientific publications roundup
2023 has been a record year for clients using the Nanolive system in their scientific publications. The number of peer-reviewed publications has continued to increase, and there has been a real growth in groups publishing pre-prints to give a preview of their work....
Nanolive microscopes

CX-A
Automated live cell imaging: a unique walk-away solution for long-term live cell imaging of single cells and cell populations

3D CELL EXPLORER-fluo
Multimodal Complete Solution: combine high quality non-invasive 4D live cell imaging with fluorescence

3D CELL EXPLORER
Budget-friendly, easy-to-use, compact solution for high quality non-invasive 4D live cell imaging