Staurosporine: the protein kinase inhibitor that packed a powerful punch
Staurosporine is a powerful antiproliferative agent that inhibits tumor cell growth by inducing cell death via intrinsic apoptotic pathways. Discovered in a soil sample in 1977 by scientists from the Kitasato Institute in Japan (1), Staurosporine was the first protein kinase inhibitors to be detected. Although not clinically useful in its native state – it is far too potent and non-specific to be used directly in humans (2) – Staurosporine has contributed greatly to cancer research over the last 45 years; leading to the ‘Compound first, Bioactivity second’ revolution in the 1980’s (3) and acting as a parent compound for numerous highly-successful anti-cancer derivatives (1).
And left a lasting legacy
As of September 2021, 73 small molecule kinase inhibitor drugs had received approval for clinical use from the FDA and hundreds more are in advanced clinical phase trials (4). The renewed interest in Staurosporine and its analogues within the drug discovery world largely reflects the technological advancement of drug delivery systems. Encapsulating drugs within liposomal nanoparticles is one such example of how off-target side-effects can be reduced without suppressing drug potency and therefore, its efficacy against solid tumors (5).
But how can Nanolive accelerate the development of small molecule inhibitors?
Evaluating the toxicity of different compounds and/or drug delivery systems during the development phase of drug discovery can be complicated: the use of in vivo animal models is fraught with ethical issues, traditional cytotoxicity cell assays tend to be limited to end-point analyses, and fluorescence-based live cell imaging techniques suffer from artefactual cytotoxic or cytostatic effects. But all this is about to change thanks to Nanolive’s innovative imaging platform.
Our technology is 100 % label-free and non-invasive, which means cells can be continuously imaged (with sub-cellular resolution) for long periods of time. This, combined our integrated image analysis software solution Eve Analytics, provides access not only to the degree, dynamics, and rate of cell death, but also the nature, magnitude, and kinetics of the phenotypic changes that precede death.
Dissecting the kinetics of Staurosporine-induced cell death using Nanolive imaging
In this example, we investigate the phenotypic response of HeLa cells to 625 nM of Staurosporine (n = 3) and compare the response to cells kept in control conditions (n = 2). Images were captured every 15 mins 15 s for a total of 65 h using Nanolive’s automated microscope, the CX-A.
Cells exposed to Staurosporine showed obvious signs of stress right from the start of the experiment (Video 1). Untreated cells were primarily short spindle- and triangle-shaped (Video 1; inset) whereas Staurosporine-treated cells were retracted and round-shaped with long protrusions evident from the start (Video 1). The formation of non-branched, long cell protrusions has been observed in HeLa cells treated with Staurosporine in other studies (6); these are formed quickly (< 30 mins; (6)) and so their formation was not captured during this experiment.
Image analysis was performed in Eve Analytics. The quality of the segmentation of Staurosporine-treated cells was excellent (Video 1), which allowed to investigate the dynamic, kinetic response of cells to Staurosporine with high confidence. Metrics were normalized to time point 1 to account for any density- or seeding-dependent effects and then averaged by treatment over time. Relative changes in confluence, extent, compactness, and dry mass are shown in the figure below (Fig. 1).

The graphs accurately capture what we observe in the video: cells in control conditions showed no signs of stress: confluence increased by 50 %, compactness by 30 %, and dry mass by 30 % over the duration of the experiment, while cell extent stayed stable.
The response to Staurosporine was markedly different and can be largely split into four phases. The first phase (0 to ∼5 h) describes the motile stress response; confluence increases slightly, while cell compactness doubles. The second phase (5 h to ∼12 h) captures the moment cells are immobilized. All metrics remain stable during this phase. Staurosporine-induced decreases in motility have been observed in other cells lines, notably in human lung adenocarcinoma A549 cells (7). The third phase (12 h to ∼40 h) describes the active killing of the cells; confluence halves and cell extent increases by 20 % (cells have relatively large extents when they are circular or elliptical and have no protrusions). Both compactness and dry mass decrease (by 40 and 33 %, respectively) during this phase. In the last phase (40 h to 65 h) all cells are dead and so, there are no changes in the metrics.
This example serves to show the richness of the content contained in Nanolive’s images. Such high content analysis has the potential to revolutionize small molecule inhibitor research by providing researchers detailed information about cell death dynamics.
References
(1) Nakano, H., and Ōmura, S. J. Antibiot. 62(1): 17-26 (2009).
(2) Ōmura, S. et al. J. Antibiot. 71(8): 688-701 (2018).
(3) Ōmura, S. Microbiol. Rev. 50: 259-279 (1986).
(4) Ayala-Aguilera, C.C., et al. J. Med. Chem. 65(2): 1047-1131 (2021).
(5) Mukthavaram, R., Int. J. Nanomedicine. 8: 3991-4006 (2013).
(6) Kohno, T., et al. Mol. Pharmacol. 87(5): 815-824 (2015).
(7) Wang, Y., et al. BMC Cancer. 9(1): 1-2 (2009).
Read our latest news
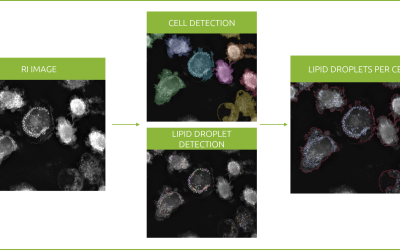
Revolutionizing lipid droplet analysis: insights from Nanolive’s Smart Lipid Droplet Assay Application Note
Introducing the Smart Lipid Droplet Assay: A breakthrough in label-free lipid droplet analysis Discover the power of Nanolive's Smart Lipid Droplet Assay (SLDA), the first smart digital assay to provide a push-button solution for analyzing lipid droplet dynamics,...
Food additives and gut health: new research from the University of Sydney
The team of Professor Wojciech Chrzanowski in the Sydney Pharmacy School at the University of Sydney have published their findings on the toxic effect of titanium nanoparticles found in food. The paper “Impact of nano-titanium dioxide extracted from food products on...
2023 scientific publications roundup
2023 has been a record year for clients using the Nanolive system in their scientific publications. The number of peer-reviewed publications has continued to increase, and there has been a real growth in groups publishing pre-prints to give a preview of their work....