Glioblastoma: the most aggressive brain cancer
Glioblastoma multiforme (GBM) is an aggressive brain tumor that places among the most lethal of cancers. Unfortunately, most patients with GBMs die of their disease in less than a year and long-term survival prospects are slim to none (1). Treating GBM is extremely complicated. Various deletions, amplifications, and point mutations overactivate receptor tyrosine kinases (RTKs) downstream signalling, which makes RTKs a compelling target for therapeutic inhibition (2).
Is there a difference in the responses of glioblastoma cells and pre-adipocyte cells to receptor tyrosine kinase inhibition?
We exposed glioblastoma (cell line: LN71) and 3T3-derived pre-adipocyte cells to a RTK-inhibitor and imaged their response (for details on the RTK receptor function and its inhibition, see Figure 1). One image was acquired every 113 secs using the 5×5 gridscan mode (an area of 450 µm) on Nanolive’s CX-A. The resulting images were stitched, segmented, and analysed using tools developed in-house. Cell count, confluency, compactness, area and extent were calculated and plotted as scatter plots, with pre-adipocyte responses shown in green and glioblastoma in orange.
Analyzing the response of pre-adipocytes to RTK-inhibition
At the beginning of the experiment, pre-adipocyte cells display a normal phenotype, with spiky protrusions. Within 1 h of RTK-inhibitor addition, signs of stress start to become evident. Cells start to lose their protrusions and adherence and the cell becomes more circular. This was expected because RTK activity is also required for establishing and maintaining adherence (3), and it is reflected in the metrics by the reduction in average cell area and increase in extent. Confluence also decreases, despite cell division being unaffected for the first 7 h of incubation (see increase in cell count). Cells start to die 4 h after the inhibitor was added, mainly by apoptosis (see Figure 2). It is easy to distinguish apoptosis from other forms of cell death because we observe the formation of the small packets of membrane that contain the cell’s contents before the cell dies.

Figure 1
RTK receptor: phosphorylation of the receptor at the TK domain leads to signal transduction, resulting in cell proliferation, differentiation, migration, and survival. When RTK is inhibited by tyrosine kinase inhibitors (TKIs), phosphorylation is prevented, causing apoptosis and cell death. Schema adapted from Hojjat-Farsangi, M., (2014). Small-Molecule Inhibitors of the Receptor Tyrosine Kinases: Promising Tools for Targeted Cancer Therapies. Int. J. Mol. Sci. 2014, 15(8), 13768-13801
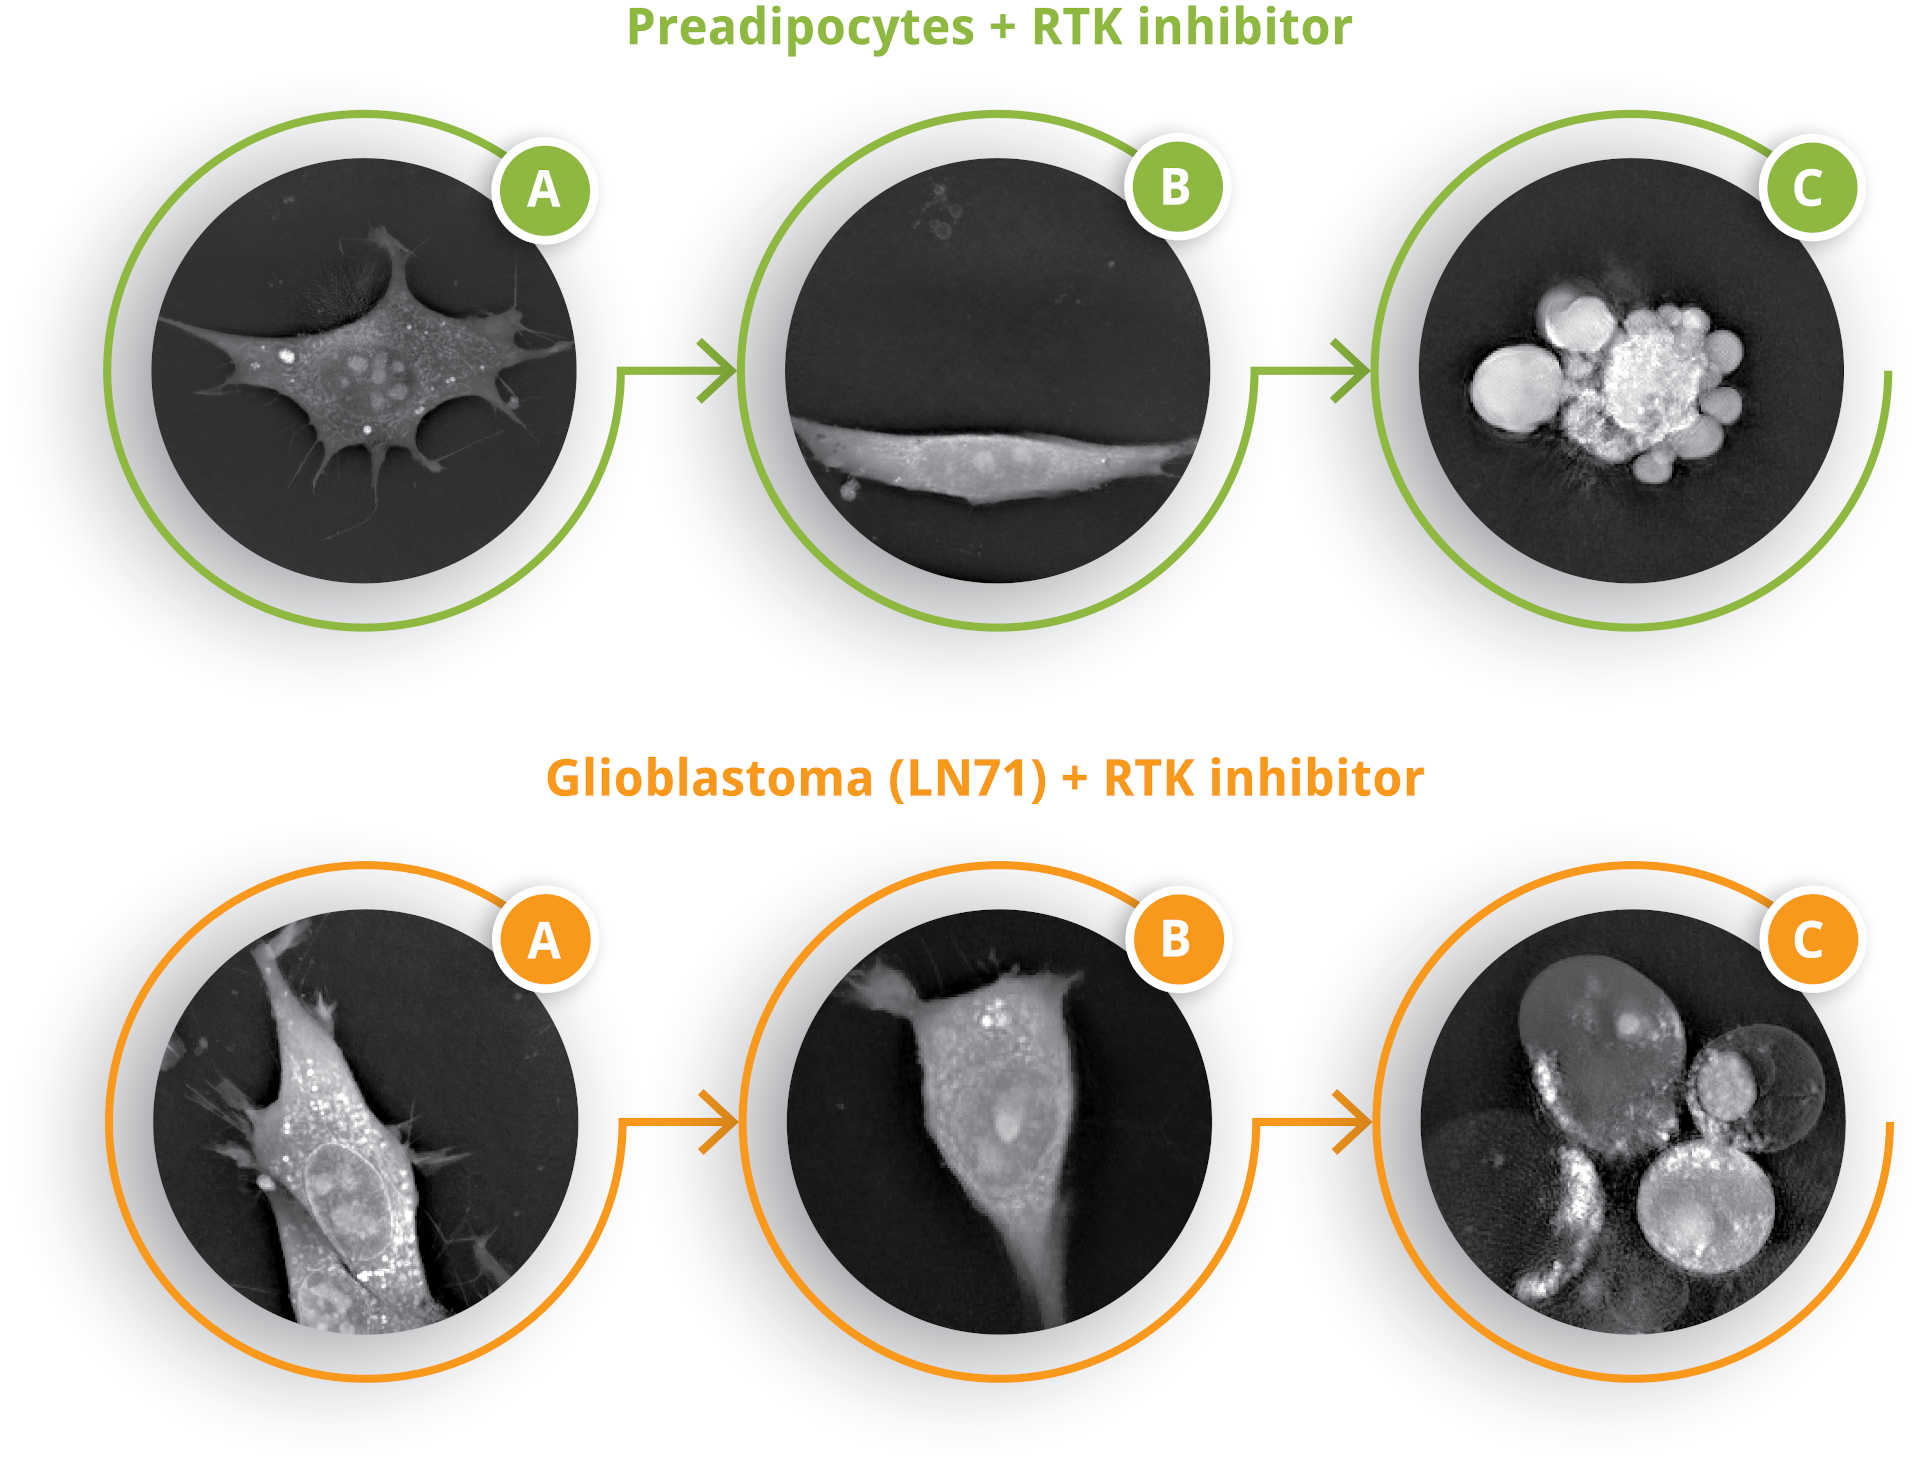
Figure 2
Cell morphology over time. Top: Preadipocytes + RTK inhibitor: A) Common pre-adipocyte morphology with spiky protrusions. B) Loss of protrusions and adherence; cell becomes rounded. C) Cell death in pre-adipocytes was dominated by apoptosis, distinguishable from other forms of cell death by the small packets of membrane that are formed just before cell death. Down: Glioblastoma (LN71) + RTK inhibitor: A) Common LN71 cell morphology. B) Cell becomes smaller and compact. C) Cell death in glioblastoma cell was dominated by necroptosis, a lytic cell death pathway.
How do glioblastoma cells respond to RTK-inhibition?
A similar response is observed in glioblastoma cells; cell division is unaffected in the first 6 h (see cell count and confluency) but the average cell becomes slightly smaller and more compact. Cells start to die soon after, but this time death is dominated by necroptosis, a lytic cell death pathway (see Figure 2). A loss of apoptotic control is characteristic of the changes that cells undergo during oncogenesis. In fact, it is this loss that allows cancer cells to survive long enough to increase mutations that make them more invasive (4).
What can we take from this study?
This video exemplifies how Nanolive cell imaging can be used to compare the phenotypic reactions of different cell types to drugs in both a quantitative and qualitative manner. This can be used to test and develop inhibitors of specific pathways that have shown promising anticancer activity against GBM. Want to know more? Click here to read how pre-adipocytes and glioblastoma cells respond to a cyclin-dependent kinase 2 (CDK2) inhibition; or here to watch our webinar “accelerating oncology drug discovery with label-free imaging”, where we test 8 different inhibitors or modulators of kinase activity.
References
(1) Maher EA, Furnari FB, Bachoo RM, Rowitch DH, Louis DN, Cavenee WK, DePinho RA. 2001. Malignant glioma: genetics and biology of a grave matter. Genes & Development. 1;15(11):1311-33.
(2) Stommel JM, Kimmelman AC, Ying H, Nabioullin R, Ponugoti AH, Wiedemeyer R, Stegh AH, Bradner JE, Ligon KL, Brennan C, Chin L. 2007. Coactivation of receptor tyrosine kinases affects the response of tumor cells to targeted therapies. Science. 12;318(5848):287-90.
(3) Chiasson-MacKenzie C, McClatchey AI. 2018. Cell-cell contact and receptor tyrosine kinase signaling. Cold Spring Harbor Perspectives in Biology. 1;10(6):a029215.
(4) Knight T, Luedtke D, Edwards H, Taub JW, Ge Y. 2019. A delicate balance – the BCL-2 family and its role in apoptosis, oncogenesis, and cancer therapeutics. Biochemical pharmacology. 1;162:250-61.
Read our latest news
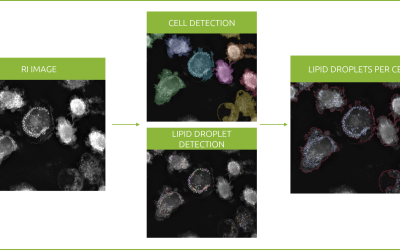
Revolutionizing lipid droplet analysis: insights from Nanolive’s Smart Lipid Droplet Assay Application Note
Introducing the Smart Lipid Droplet Assay: A breakthrough in label-free lipid droplet analysis Discover the power of Nanolive's Smart Lipid Droplet Assay (SLDA), the first smart digital assay to provide a push-button solution for analyzing lipid droplet dynamics,...
Food additives and gut health: new research from the University of Sydney
The team of Professor Wojciech Chrzanowski in the Sydney Pharmacy School at the University of Sydney have published their findings on the toxic effect of titanium nanoparticles found in food. The paper “Impact of nano-titanium dioxide extracted from food products on...
2023 scientific publications roundup
2023 has been a record year for clients using the Nanolive system in their scientific publications. The number of peer-reviewed publications has continued to increase, and there has been a real growth in groups publishing pre-prints to give a preview of their work....
Nanolive microscopes
3D CELL EXPLORER
Budget-friendly, easy-to-use, compact solution for high quality non-invasive 4D live cell imaging
3D CELL EXPLORER-fluo
Multimodal Complete Solution: combine high quality non-invasive 4D live cell imaging with fluorescence
CX-A
Automated live cell imaging: a unique walk-away solution for long-term live cell imaging of single cells and cell populations